Business Intelligence has been around for a very long time and all companies have at least some form of it, whether it is a written ledger or whether they are using the most cutting edge, advanced and innovative BI solution such as Pentaho ;). That being said, Exception Reporting is still not widely used in today's business. What exactly is exception reporting? I am glad you asked.
Exception reporting is a method of reporting that, well, reports on the exceptions, which is A person or thing that is excluded from a general statement or does not follow a rule. One of the key words is "rule", so to really be able to effectively do exception reporting, a business must have some key business rules in place in order to know what exception they are looking for, here are a couple of industry specific examples:
Customer Service Example
Have you ever eaten fast food? I am sure you have and you probably have noticed when going through a drive through that many of them have a timer clock by the window showing the current wait time. Why is this? This is because the company has deemed it important to monitor what the average wait time is for their customers. The smaller the average the higher the customer satisfaction...hence the name...fast food. The timer is there for the benefit of the line workers. Shift managers are well aware of what the acceptable average wait times are and are often compensated for staying within range or even beating expectations. What exception reporting does is collects all the information and presents it from a summary down to a granular basis. Follow me here...Somewhere, back at corporate there is a person who is responsible for managing what the average wait time is for their customers among other things. Now this person cannot sit there just staring at a dashboard that says what the average wait time is, so what they have done is setup some exception reporting. To do this, they have defined the acceptable limits in which the company allows. For example, an acceptable wait time is anywhere between 30 seconds and 3 minutes. Any time the average falls above that range, the responsible party is notified and is offered the ability to click on the number and receive a list of only those stores that are above the limits along with what their average wait time currently is.
Financial Example
Financial institutions commonly have very strict regulations that they must abide by and these regulations change often. Due to this, they often have implement a vast array of different information systems needed to meet these regulations. The problem is that now they have the burden of making sure that these systems are in balance. Any time you increase the complexity and diversity of all these information systems, you typically run into a data integration nightmare. You have data spread out among many systems, some of them duplicated and some not. In regards to the data that must be duplicated, it is important that those systems be able to reconcile with each other. Recently, I helped a company be able to do this. Their current process was to receive a report from one of their financial systems via a PDF, due to the system being a SaaS application with certain limitations and reconcile that with a legacy system they have. It was a few people job to look at this report that was over 2,000 pages and compare account balances across both systems. When the balances did not match, they had to look at the detail information and make any appropriate journal entries in order to correct it. Since neither of these systems "talked" to each other, this was a very hands on, manual process. Well, a little bit of know how and of course Pentaho, they now are able to connect to both systems and compare balances automatically and create a report that only contains accounts that don't reconcile with drill down to detail capability...saving days of several FTEs (full time employees).
Pentaho is rather unique in that the way our Data Integration and Business Analytics are architected, performing exception reporting is well exceptional. My apologies for such a corny ending...but...I am a father of 5...one has to have a sense of humor at this point ;)
BTW - Happy New Years to all my blog followers, I appreciate all your views!
Showing posts with label Business Intelligence. Show all posts
Showing posts with label Business Intelligence. Show all posts
Tuesday, January 03, 2012
Tuesday, October 18, 2011
Use Case: Grouping by Time, A Call Center Story
Recently a company that operates a rather large call center came to Pentaho to help them be able to better analyze their data and gain better insight to the performance and efficiency of their agents. One of the issues they had was that they wanted to see their call center data grouped by particular time categories so that they can better manage staffing for peak hours of the day as well as view who are the top performing agents in terms of volume. They had some basic information but the problem was that they wanted to have the grouping within the database so that they can gain some additional performance in pre-aggregating the data, due to the large volume of calls that are occurring. Here is a sample of what the data looked like (the sample below is only sample data generated by a sample data generator).

The first step in this process is to make the data "BI Ready", in other words take the data and convert to information by enriching it and grouping it by the designated time buckets, for this particular example they want to bucket their time in 15 minute increments starting from 8:00 to 5:00 (the operating hours of the call center). In this example, I am only using a snapshot of data ranging from 8:00 AM to 9:00 AM. This will allow them to answer questions like
- During what time span (within 15 minutes) is the call volume the highest?
- What time categories have the highest volume of incoming calls?
- What time categories have the highest volume of outbound calls?
The end transformation looks like this:
Transformation Detailed Description
Read Call Center Data from CSV - This is a csv Input Step that reads in the data from the CSV file. This does not have to be a csv file but can be almost any flat file, database, web service, etc.
Convert Date-Time to String - This is a Select Values step that allows you to rename or change the type of any of your fields, in this step we are converting the date-time to a string in order to split it into two different fields, one field that contains only date and the other only time.
Split Date-Time Field - Field Splitter allows you to split any string field based on a common requirement. In this example because the date-time field called BeginDate in our csv file has a date-time field that is a format where the date and time are separated by a space, we use that as the delimiter to split the field.
Convert Time to Number - The convert time to number is used to convert the Time field that we created in the previous step to a number in order to do our grouping into time ranges.
Create Time Range - This step will create a new column called TimeGroup, read in the rows of data, look at the time field set the appropriate value to the newly created field. For this example we are creating four groups: 8:00 AM to 8:15 AM, 8:15 AM to 8:30 AM, 8:30 AM to 8:45 AM, and 8:45 AM to 9:00 AM.
Convert Time to Time Format - This step converts the time field back to the time data type for reporting purposes.
Dummy (do nothing) - this step, as it implies does nothing, at this point you can load the data directly into a database, flat file, etc.
The end result of this transformation looks like this:
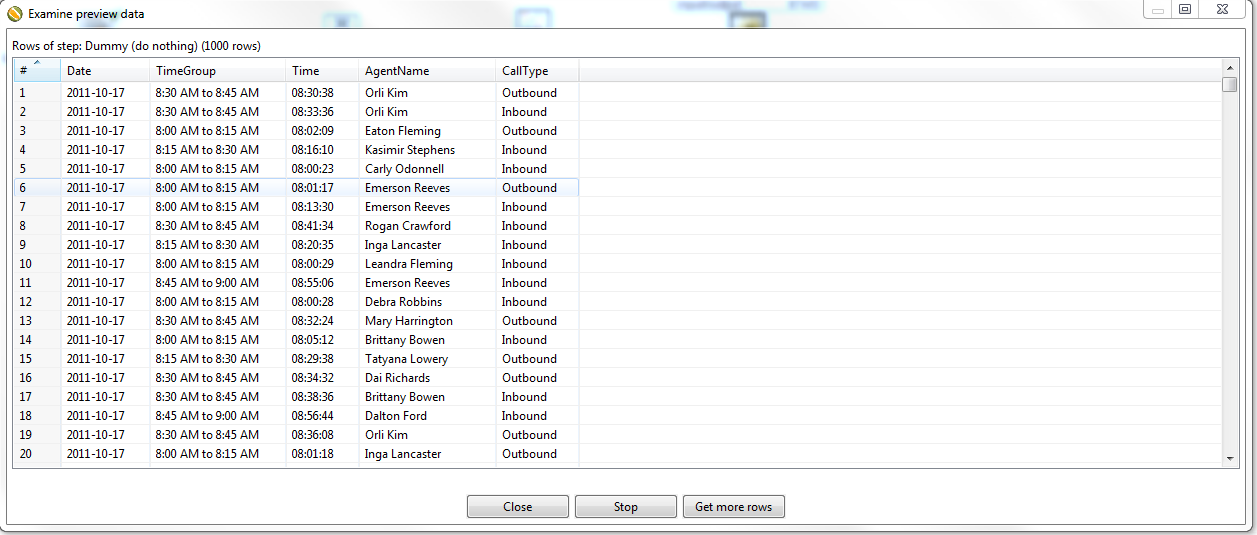
Download the zip file here for youto run this transformation. In order for it to work, you will need to import the .ktr file and then make sure to change the path of the csv file in the first step to the location of where you saved the csv file that is included in the .zip file.
Wednesday, July 28, 2010
The Right Tool For The Job - Part 2
In continuation of my previous post...I already had a tool to perform the duties I needed to changes the brakes but having just the right tool made all the difference in the time it took to successfully complete the task at hand. Took less time...and time is money!
The same holds true in BI. In the July/Aug 2010 issue of Information Management Magazine they had an articaled called Data Definition, How business and IT can speak the same language, Really. Notice how they added the word "Really" on the end of the title. This is because their is a LONG standing gap in the way IT understands data and the way that information consumers (business users) look at data. I don't know about you but nothing sounds more boring to me than defining data! I remember having vocabulary in most of my schooling where the teacher would assign a long list of words and your homework was to write out the definitions, not what I want to do on a Friday night. Looking back, that task was much easier than the daunting task for companies to define their data. The article referenced to above outlines what makes a clear or unclear data definition and one thing is certain, it takes BOTH IT and BUSINESS USERS to define data and is often a recursive task.
The article recommends the following strategy for defining your data:
- Provide examples of unclear versus clear definitions
- Understand what the business user wants to do with the data
- Bring all stakeholders together to review the definition
Thursday, June 17, 2010
The Right Tool For the Job!
Some people would call me mechanically inclined and while others may call me mechanically challenged...either way...I tend to work on my vehicle probably more than the average person. One common maintenance activity that I do perform myself is changing the brakes on my vehicle. This is a fairly simple job in terms of concept but can be tedious due to the difficulty of getting to and working with the specific areas on the vehicle. For years I worked on these projects and it would typically take me about two hours to complete until one day, I was at an auto parts store and saw a special tool that was made specifically for part of the job of changing the brakes. It was like a gift from heaven, with this new tool, I was able to change the brakes in about 45 minutes with a lot less sweat and head ache.
So what does changing brakes have to do with BI? Nothing at all! However, the connection has to do with how using the right tool can help save you a lot of time and head ache in implementing and maintaining your BI environment. You may be successful right now but as some people say, "you don't know what you don't know" and you may have the opportunity to be even more successful. In the next few blog posts, I am going to talk about how Pentaho can help you just like me finding the right tool to help me change my brakes.
So what does changing brakes have to do with BI? Nothing at all! However, the connection has to do with how using the right tool can help save you a lot of time and head ache in implementing and maintaining your BI environment. You may be successful right now but as some people say, "you don't know what you don't know" and you may have the opportunity to be even more successful. In the next few blog posts, I am going to talk about how Pentaho can help you just like me finding the right tool to help me change my brakes.
Subscribe to:
Posts (Atom)