One of the many powerful features of Pentaho is the ability for Pentaho Reporting and Pentaho Data Integration to seamlessly work together. This example will walk through a typical use case within many organizations. Let's say you want to report of multiple disparate data sources. You may have a database, a csv file, and a flat file that you want to be able to join the data together and report from but you don't want to have to combine this data in a data store. Additionally, you may want to give the end users the ability to sort this data.
USE CASE - Reporting from Raw Call Log Summary Information
I have a client who has accesses to some summary telephony data that records the outbound calling of their agents. Besides having a record of these outbound calls, they have another solution that also records the inbound calls. This inbound system reporting is a separate from their outbound system in terms of the storage of that data. Both outbound and inbound record sets records the same information, AgentID, CallType, and Duration. The outbound data file CallType column all contain the same CallType of outbound and the inbound data file has the value of inbound. They want to merge these disparate files and also lookup the AgentID from another source that lists all their agents with their corresponding IDs, this way on their report they can list the agent name instead of their ID.
SOLUTION - Pentaho Data Integration and Pentaho Report Designer
Pentaho Data Integration
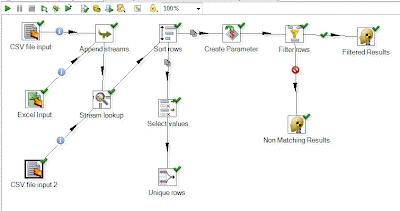
What I have done is use PDI to bring all the data together and make it available for Report Designer. The transformation is made up of the following steps:
- CSV file input - This is the outbound call records
- Excel Input - This is the inbound call records
- Append Streams - This merges the outbound and inbound records into one data set
- Stream Lookup - This step looks up the value of AgentID in order to get the Agent Name
- CSV file input 2 - This step contains the AgentID along with the corresponding Agent Name
- Sort rows - This sorts the rows by Agent Name
- Unique Rows - This returns a list of Unique Agent Names use in the parameter list within our report
- Create Parameter - This defines a parameter that will be used to filter the results
- Filter rows - This will use the parameter to filter out the desired results
- Filtered Results - Displays all the desired results
- Non Matching Results - Displays all the results that were not selected
Once this transformation is created then it needs to be exported as an .ktr (xml) file and is now ready to be consumed by Report Designer.
Pentaho Report Designer
Once in Report Designer I can create a report and add a Pentaho Data Integration data source. All I will need to do is point to that transformation location (this is the .ktr file that you exported from Pentaho Data Integration). When you bring that transformation into Report Designer, it will ask you to select which step to utilize. This give you the ability to report from any point within the data integration step listed above. For this example, we will consume information from the Filtered Results step. In this report, we are also building a parameter which allows end users of this report to select which Agent they want to view the data for. We are dynamically building this list by selecting the Unique Rows step in our data integration transformation.
In order to get this example to work in your environment, you will need to download the files here, these files include:
- Multiple Sources with Parameter.ktr - Transformation
- Sample Report from three Sources with Parm.prpt - Report
- outbound.csv - Contains outbound call log data
- inbound.xls - Contains inbound call log data
- agentLookup.csv - Contains Agent Name lookup by AgentID Data
Make the following modifications to the Multiple Sources with Parameter.ktr file:
- Open the Multiple Sources with Parameter.ktr by going into Pentaho Data Integration and selecting File -> Import from an XML File
- Edit the following steps and point them to the files you downloaded:
- CSV file input - point to outbound.csv
- Excel Input - point to inbound.xls
- CSV file input 2 - point to agentLookup.csv
- Save transformation (this will save it to your repository)
- Export the transformation to the location where you saved the original (you can overwrite the original)
Make the following changes in the Sample Report from three Sources with Parm.prpt in Report Designer:
- Open the Report in Report Designer
- Click on the "Data" tab on the right side of Report Designer
- Double Click "Agent List" under the Pentaho Data Integration Data Set, browse to your recently saved and exported transformation and select the "Unique rows" step in the steps list.
- Double Click "Query 1" under the Pentaho Data Integration Data Set, browse to your recently saved and exported transformation and select the "Filtered Results" step in the steps list.
- Click on the preview button to see it work.


