Thursday, July 18, 2013

Monday, April 29, 2013
The Dirty Truth About Data and How To Clean It Using Pentaho!
Anyone who has worked with data has been there. You are trying to bring data into your organization in order to merge it with other data so that you can provide a complete picture of:
- Your Organization
- Your Customers
- Your Industry
- How all the above relate together
Setting the Stage
In this example, I am going to consume information from a flat file (csv) that has been provided to me through a third party vendor that I am paying to do sentiment analysis on my products. This fictitious company, called Big Wireless, is a company that sells wireless products (cell phones, tablets, notebooks, etc) and services (cell phone, home line, etc).
The purpose of this exercise is to bring the data that is being provided by this third party (which I receive on a daily basis). When processing the data, I need to capture any records that have bad or malformed data and report this back to the third party vendor. In other words, I am paying for a service from them and this lets me verify that I am getting what I am paying for and can use this to make sure that they are living up to their QOS.
Below is a recorded demonstration of the following (based on the information above):
- Read in the CSV file from my 3rd Party Vendor
- Keep track of any "dirty" data
- Validating the expected Sentiment
- Doing a fuzzy lookup in order to standardize on my companies product names
- Enriching the data through several lookups"
- Look up Detailed Product Information
- Lookup Geocode on where the tweet originated
- Create some new time dimensions
- Put it in my data base for further analysis
Monday, April 22, 2013
The Future of Business Analytics Changes Today!
Pentaho Acquires Dashboard and UI Specialist Partner Webdetails
Portugal-based consultancy provides visual development expertise, consulting services and a new community leader
Portugal-based consultancy provides visual development expertise, consulting services and a new community leader
- Learn more about how to bring 'The Art of the Possible' to life with Webdetails
- Pentaho is hiring and seeking superstars worldwide. Visit our careers page to learn more.
- Follow Pentaho on Twitter @Pentaho.
Orlando, Fla — April 22, 2013 —
Delivering the future of analytics, Pentaho announced today that it has completed the acquisition of its Portugal-based consulting partner Webdetails.
Pentaho will benefit from Webdetails’ visual interface development
expertise and international consulting services provided by its
20-strong team. Webdetails’ founder Pedro Alves is a high-profile member
of Pentaho’s open source community and will take on the new role of
Senior VP, Community for Pentaho. As both parties are privately-held,
the financial terms of the deal are undisclosed.
Raising Pentaho’s “visibility”
The Webdetails acquisition will complement and accelerate Pentaho’s research and development plans to enrich the user experience for both IT and business users of its business analytics platform and big data integration tools. This will include expanding Pentaho’s range of data visualizations available in dashboards, making visual development tools like Instaview even easier to use and delivering new visual interfaces to help new customers get started.
Webdetails has been designing plug-ins for Pentaho for several years, most notably its Community Tools or “CTools” series for creating and managing dashboards and reports. Last November, Webdetails collaborated with Pentaho to launch the Pentaho Marketplace, a destination on github where developers can share, install and load cool plug-ins.
Meeting growing demand for Pentaho’s consulting services
As demand for advanced, big data and embedded analytics services continues to soar, Webdetails provides an experienced, international team to bolster Pentaho’s existing consulting services. Webdetails provides services worldwide, with most of the revenue stream coming from US and Europe. List of clients include 4SightBI, St. Antonius Hospital, and Pentaho’s award-winning customer Stonegate Senior Living.
Redoubling community support
In addition to continuing his role as General Manager for Webdetails’, founder Pedro Alves will take on the new role of Senior VP, Community. In this latter role, Alves will be the chief advocate and interface to Pentaho’s active open source developer community.
Doug Johnson, EVP and COO, Pentaho commented, “Everything about Webdetails perfectly complements our operations as we continue to scale to meet demand fueled by the big data revolution. Webdetails’ expertise in high-end visualizations brings capabilities to help customers roll out exceptional visualizations with all data sources, particularly in Big Data. With Webdetails joining the Pentaho family we gain visual development talent, international consulting services and a highly respected open source community leader in Pedro.”
Pedro Alves (@pmalves), commented, “After five years as consultants and advocates for Pentaho in the business and open source communities, my team is incredibly proud to be officially joining the company. On a personal note, I am delighted to be taking on the role as community leader and look forward to the opportunity and challenge that this presents.”
Webdetails will continue doing business under its existing brand, but as a Pentaho company.
Raising Pentaho’s “visibility”
The Webdetails acquisition will complement and accelerate Pentaho’s research and development plans to enrich the user experience for both IT and business users of its business analytics platform and big data integration tools. This will include expanding Pentaho’s range of data visualizations available in dashboards, making visual development tools like Instaview even easier to use and delivering new visual interfaces to help new customers get started.
Webdetails has been designing plug-ins for Pentaho for several years, most notably its Community Tools or “CTools” series for creating and managing dashboards and reports. Last November, Webdetails collaborated with Pentaho to launch the Pentaho Marketplace, a destination on github where developers can share, install and load cool plug-ins.
Meeting growing demand for Pentaho’s consulting services
As demand for advanced, big data and embedded analytics services continues to soar, Webdetails provides an experienced, international team to bolster Pentaho’s existing consulting services. Webdetails provides services worldwide, with most of the revenue stream coming from US and Europe. List of clients include 4SightBI, St. Antonius Hospital, and Pentaho’s award-winning customer Stonegate Senior Living.
Redoubling community support
In addition to continuing his role as General Manager for Webdetails’, founder Pedro Alves will take on the new role of Senior VP, Community. In this latter role, Alves will be the chief advocate and interface to Pentaho’s active open source developer community.
Doug Johnson, EVP and COO, Pentaho commented, “Everything about Webdetails perfectly complements our operations as we continue to scale to meet demand fueled by the big data revolution. Webdetails’ expertise in high-end visualizations brings capabilities to help customers roll out exceptional visualizations with all data sources, particularly in Big Data. With Webdetails joining the Pentaho family we gain visual development talent, international consulting services and a highly respected open source community leader in Pedro.”
Pedro Alves (@pmalves), commented, “After five years as consultants and advocates for Pentaho in the business and open source communities, my team is incredibly proud to be officially joining the company. On a personal note, I am delighted to be taking on the role as community leader and look forward to the opportunity and challenge that this presents.”
Webdetails will continue doing business under its existing brand, but as a Pentaho company.
Sunday, April 14, 2013
Pentaho Big Data Forum - Washington D.C.
Featured Speakers:
- Michael Lazar, Senior Systems Engineer, Cloudera
- Will LaForest, Senior Director, 10gen
- Ruhollah Farchtchi, Director of Federal Systems, Unisys
- Wayne Johnson, Sales Consultant, Pentaho
- Will Gorman, VP Chief Architect, Pentaho
- Matt Casters, PDI Architect, Pentaho
Join
Pentaho for a half-day big data forum in Washington D.C. Do not miss
out on the opportunity to connect with key Pentaho leaders and hear the
latest big data hot topics from our featured partners, Cloudera, 10gen
and Unisys.
Agenda:
Date:
Tuesday, April 23, 2013
Tuesday, April 23, 2013
Location:
Artisphere
1101 Wilson Blvd.
Arlington, VA 22209
Artisphere
1101 Wilson Blvd.
Arlington, VA 22209
For questions or more information, please contact Laura Tuohy at ltuohy@pentaho.com.
| Time | Agenda Item |
| 8:00 a.m. - 8:30 a.m. | Breakfast & Registration |
| 8:30 a.m. - 9:30 a.m. | Pentaho Big Data Update |
| 9:30 a.m. - 10:15 a.m. | Cloudera Big Data Presentation |
| 10:15 a.m. - 10:30 a.m. | Pentaho Business Analytics Update & Demo |
| 10:30 a.m. - 10:45 a.m. | Coffee Break |
| 10:45 a.m. -11:30 a.m. | 10gen Big Data Presentation |
| 11:30 a.m. - 12:00 p.m. | Unisys Big Data Presentation |
| 12:00 p.m. - 1:00 p.m. | Lunch & Kettle Presentation on PDI for Big Data |
Friday, July 27, 2012
Olympic Analysis
In honor of the Olympics starting today...here is an Analytical Dashboard I created to compare and contrast the medaling countries from 1976 to 2008. Enjoy
Wednesday, May 30, 2012
Cohort Analysis using Pentaho
Sorry for the quality...I am working on a better quality video...Thanks!
Wednesday, May 02, 2012
Come hear me present Pentaho (sneak peak to my next use case)
If you are interested in seeing what I have been up to lately, please feel free to join me at 9:00 AM EST or 1:00 PM EST:
http://www.pentaho.com/resources/events/20120503-pentaho-business-analytis-4.5/
http://www.pentaho.com/resources/events/20120503-pentaho-business-analytis-4.5/
Sunday, April 29, 2012
Big Data, Business Analytics, Rich Visualizations, it's all here!
This week I will have the honor to show you guys something that I think is pretty amazing...and seeing how many people are adopting our technology, many of you find amazing as well. This week Thursday, May 3rd, I will be hosting two events, showing the power and capability of Pentaho. So what does Big Data, Business Analytics and Rich Visualizations have in common? Well...you will just have to register to find out!
I will give you one clue though...you will get to learn this while simultaneously learning about a compelling, real world example of Business Intelligence

9:00 AM ET / 14:00 GMT
10:00 AM PT / 1:00 PM ET
Register Today
Director, Product & Solutions Marketing
Pentaho Corporation
Wayne Johnson
Senior Sales Engineer
Pentaho Corporation
I will give you one clue though...you will get to learn this while simultaneously learning about a compelling, real world example of Business Intelligence

Date and Time
Thursday May 3, 20129:00 AM ET / 14:00 GMT
10:00 AM PT / 1:00 PM ET
Register Today
Speakers
Donna PrlichDirector, Product & Solutions Marketing
Pentaho Corporation
Wayne Johnson
Senior Sales Engineer
Pentaho Corporation
Wednesday, April 25, 2012
Pentaho 4.5 is here
This is a very short blog and I will have more information coming very soon but you HAVE GOT to check this out...Pentaho 4.5 has new visualizations that really help build very useful analytics...use cases coming soon...plus if you want to see me in action, I will be doing worldwide webinars...see below:
- Visit pentaho.com/4.5-release to
learn more about the new release and why ‘Better Together’ is best.
- Download a free 30-day fully
supported trial of the Pentaho Business Analytics 4.5.
- Attend the live demo of what’s new in Pentaho Business Analytics
4.5 on May 3, 2012. Register at pentaho.com/4.5-webinar.
Monday, March 19, 2012
Processing Zip Files using Pentaho Data Integration
Recently I was on a call and the requirement was that they received zip files that contain a .csv file from their customers and needed to take the contained .csv file and put it into a database. In this particular example, the structure of the .csv file is already known. Currently this process is a manual process where they unzip the file, take that file and run it into a transformation that populates it into a database. Their goal is to automate this process. In the example below I have created a transformation that shows how Pentaho Data Integration can automatically take a zip file, unzip it, pass the contents to a transformation, process the file into a database.


The first step is to create a Job that handles the unzipping of the file

The job then passes that file to a transformation that takes the enclosed .csv file, processes it and inserts it into a database:

I have created a file for you to download a working example. In order to run through this example you need to perform the following:
- Download the “PDI - UNZIP AND PROCESS FILE.ZP” file and extract its’ contents into a directory called “PDI - UNZIP AND PROCESS FILE”
- Open up Pentaho Data Integration (do not connect to the repository)
- Open the following job: “unzip.kjb”
- Open the following transformation: “populated database from unzipped file.ktr”
- In the transformation, open up the “Table Output Step”
- Select the “SQL” button and then select “Execute”, then click “ok” and “close” on the next two dialog screens.
- NOTE – We are using a database that comes with Pentaho for testing purposes
- Now you can go to the job and run the job. The following will happen:
- The zip file contents will placed in the main directory “PDI - UNZIP AND PROCESS FILE.ZP” and be called sales_data_{timestamp}.csv
- The job will then take the location of that .csv file and pass it to the transformation, which will take that file and insert it into the database
Wednesday, February 22, 2012
Creating a Dynamic Target Range using Pentaho Report Designer and a Line Chart
Here is a quick example of how you can easily create a line chart with the ability to dynamically set a target range on the chart. Here is what the end results look like:

How do you do this? Well it is really pretty straight forward. First you create your connection and retrieve the data you want to graph. Then drag a chart object to your report and set the category-column, value-column, and Series-by-value to your data. Once you have your chart reading your data set, next you will create your parameters, here is an example of the lower range parameter

Once you have your parameters created so that end users can dynamically set the range, all you need to do is add a post-processing script, you can use the script below (I've highlighted the parameters as well):
import java.awt.Color;
import java.awt.Dimension;
import java.awt.Font;
import java.awt.GradientPaint;
import javax.swing.JPanel;
import org.jfree.chart.ChartFactory;
import org.jfree.chart.ChartPanel;
import org.jfree.chart.JFreeChart;
import org.jfree.chart.axis;
import org.jfree.chart.axis.CategoryAxis;
import org.jfree.chart.axis.CategoryLabelPositions;
import org.jfree.chart.axis.NumberAxis;
import org.jfree.chart.labels.ItemLabelAnchor;
import org.jfree.chart.labels.ItemLabelPosition;
import org.jfree.chart.labels.StandardCategoryItemLabelGenerator;
import org.jfree.chart.plot.CategoryPlot;
import org.jfree.chart.plot.IntervalMarker;
import org.jfree.chart.plot.PlotOrientation;
import org.jfree.chart.renderer.category.BarRenderer;
import org.jfree.data.category.CategoryDataset;
import org.jfree.data.category.DefaultCategoryDataset;
import org.jfree.text.TextUtilities;
import org.jfree.ui.ApplicationFrame;
import org.jfree.ui.Layer;
import org.jfree.ui.RectangleAnchor;
import org.jfree.ui.RefineryUtilities;
import org.jfree.ui.TextAnchor;
CategoryPlot plot = chart.getCategoryPlot();
plot.setBackgroundPaint(Color.lightGray);
plot.setDomainGridlinePaint(Color.white);
plot.setRangeGridlinePaint(Color.white);
IntervalMarker target = new IntervalMarker(dataRow.get("range1"), dataRow.get("range2"));
target.setLabel("Target Range/Goal");
target.setLabelFont(new Font("SansSerif", Font.ITALIC, 11));
target.setLabelAnchor(RectangleAnchor.LEFT);
target.setLabelTextAnchor(TextAnchor.CENTER_LEFT);
target.setPaint(new Color(222, 222, 255, 128));
plot.addRangeMarker(target, Layer.BACKGROUND);
return chart;
That is really all it takes! If you want to see a working example of this, feel free to download the sample .prpt file here.
HAPPY CHARTING!!!

How do you do this? Well it is really pretty straight forward. First you create your connection and retrieve the data you want to graph. Then drag a chart object to your report and set the category-column, value-column, and Series-by-value to your data. Once you have your chart reading your data set, next you will create your parameters, here is an example of the lower range parameter

Once you have your parameters created so that end users can dynamically set the range, all you need to do is add a post-processing script, you can use the script below (I've highlighted the parameters as well):
import java.awt.Color;
import java.awt.Dimension;
import java.awt.Font;
import java.awt.GradientPaint;
import javax.swing.JPanel;
import org.jfree.chart.ChartFactory;
import org.jfree.chart.ChartPanel;
import org.jfree.chart.JFreeChart;
import org.jfree.chart.axis;
import org.jfree.chart.axis.CategoryAxis;
import org.jfree.chart.axis.CategoryLabelPositions;
import org.jfree.chart.axis.NumberAxis;
import org.jfree.chart.labels.ItemLabelAnchor;
import org.jfree.chart.labels.ItemLabelPosition;
import org.jfree.chart.labels.StandardCategoryItemLabelGenerator;
import org.jfree.chart.plot.CategoryPlot;
import org.jfree.chart.plot.IntervalMarker;
import org.jfree.chart.plot.PlotOrientation;
import org.jfree.chart.renderer.category.BarRenderer;
import org.jfree.data.category.CategoryDataset;
import org.jfree.data.category.DefaultCategoryDataset;
import org.jfree.text.TextUtilities;
import org.jfree.ui.ApplicationFrame;
import org.jfree.ui.Layer;
import org.jfree.ui.RectangleAnchor;
import org.jfree.ui.RefineryUtilities;
import org.jfree.ui.TextAnchor;
CategoryPlot plot = chart.getCategoryPlot();
plot.setBackgroundPaint(Color.lightGray);
plot.setDomainGridlinePaint(Color.white);
plot.setRangeGridlinePaint(Color.white);
IntervalMarker target = new IntervalMarker(dataRow.get("range1"), dataRow.get("range2"));
target.setLabel("Target Range/Goal");
target.setLabelFont(new Font("SansSerif", Font.ITALIC, 11));
target.setLabelAnchor(RectangleAnchor.LEFT);
target.setLabelTextAnchor(TextAnchor.CENTER_LEFT);
target.setPaint(new Color(222, 222, 255, 128));
plot.addRangeMarker(target, Layer.BACKGROUND);
return chart;
That is really all it takes! If you want to see a working example of this, feel free to download the sample .prpt file here.
HAPPY CHARTING!!!
Wednesday, January 25, 2012
Utilize existing SQL Code for your Report Generation with Pentaho
I often get asked if developers can utilize SQL that they already use in their legacy reports within Pentaho and the answer is always a resounding YES! There are hardly if any companies out there that have not leveraged some type of Business Intelligence, even if it is generating csv files from a SQL query within a database. So there is a common concern when making any switch in technology, especially Business Intelligence/Analytics, and that is leveraging the work you have already done. here is a short video demonstration that show how easy it is to leverage Pentaho Report Designer to simply cut and paste your existing SQL code and how to extend that by parameterizing the report. Enjoy the video!
Friday, January 20, 2012
Increasing Pentaho's Data Sampling Set to Sample your entire CSV File
Pentaho offers a very valuable capability in that you can quickly and easily prototype your data using a CSV file as your source data for the prototype. Pentaho will bring in the CSV file, automatically profile the data and set the data types and lengths. One important thing to note here, however, is the default sampling list is set to 200 rows. I would recommend that you increase this limit to the size of your CSV file. For example, if you have a CSV file that contains 10,000 rows, I would increase the limit to 10,000. The next obvious question is how do I do this? Well, it really is easy, just follow these simple steps:
- Open the following file in a text editor: C:\Program Files\pentaho\server\biserver-ee\pentaho-solutions\system\data-access\settings.xml
- Change the default value that is located in the following tag to the desired sampling amount:
data-access-csv-sample-rows>10000/data-access-csv-sample-rows> (in this tag I have increased it to 10000)
- Restart your BI Server
This will help ensure that you have a success production of your prototype so that you can show your end users how easy Pentaho is to use to slice and dice their data, build reports and dashboards.
Friday, January 06, 2012
Tuesday, January 03, 2012
Exception Reporting Can Dramatically Save Time and Money
Business Intelligence has been around for a very long time and all companies have at least some form of it, whether it is a written ledger or whether they are using the most cutting edge, advanced and innovative BI solution such as Pentaho ;). That being said, Exception Reporting is still not widely used in today's business. What exactly is exception reporting? I am glad you asked.
Exception reporting is a method of reporting that, well, reports on the exceptions, which is A person or thing that is excluded from a general statement or does not follow a rule. One of the key words is "rule", so to really be able to effectively do exception reporting, a business must have some key business rules in place in order to know what exception they are looking for, here are a couple of industry specific examples:
Customer Service Example
Have you ever eaten fast food? I am sure you have and you probably have noticed when going through a drive through that many of them have a timer clock by the window showing the current wait time. Why is this? This is because the company has deemed it important to monitor what the average wait time is for their customers. The smaller the average the higher the customer satisfaction...hence the name...fast food. The timer is there for the benefit of the line workers. Shift managers are well aware of what the acceptable average wait times are and are often compensated for staying within range or even beating expectations. What exception reporting does is collects all the information and presents it from a summary down to a granular basis. Follow me here...Somewhere, back at corporate there is a person who is responsible for managing what the average wait time is for their customers among other things. Now this person cannot sit there just staring at a dashboard that says what the average wait time is, so what they have done is setup some exception reporting. To do this, they have defined the acceptable limits in which the company allows. For example, an acceptable wait time is anywhere between 30 seconds and 3 minutes. Any time the average falls above that range, the responsible party is notified and is offered the ability to click on the number and receive a list of only those stores that are above the limits along with what their average wait time currently is.
Financial Example
Financial institutions commonly have very strict regulations that they must abide by and these regulations change often. Due to this, they often have implement a vast array of different information systems needed to meet these regulations. The problem is that now they have the burden of making sure that these systems are in balance. Any time you increase the complexity and diversity of all these information systems, you typically run into a data integration nightmare. You have data spread out among many systems, some of them duplicated and some not. In regards to the data that must be duplicated, it is important that those systems be able to reconcile with each other. Recently, I helped a company be able to do this. Their current process was to receive a report from one of their financial systems via a PDF, due to the system being a SaaS application with certain limitations and reconcile that with a legacy system they have. It was a few people job to look at this report that was over 2,000 pages and compare account balances across both systems. When the balances did not match, they had to look at the detail information and make any appropriate journal entries in order to correct it. Since neither of these systems "talked" to each other, this was a very hands on, manual process. Well, a little bit of know how and of course Pentaho, they now are able to connect to both systems and compare balances automatically and create a report that only contains accounts that don't reconcile with drill down to detail capability...saving days of several FTEs (full time employees).
Pentaho is rather unique in that the way our Data Integration and Business Analytics are architected, performing exception reporting is well exceptional. My apologies for such a corny ending...but...I am a father of 5...one has to have a sense of humor at this point ;)
BTW - Happy New Years to all my blog followers, I appreciate all your views!
Exception reporting is a method of reporting that, well, reports on the exceptions, which is A person or thing that is excluded from a general statement or does not follow a rule. One of the key words is "rule", so to really be able to effectively do exception reporting, a business must have some key business rules in place in order to know what exception they are looking for, here are a couple of industry specific examples:
Customer Service Example
Have you ever eaten fast food? I am sure you have and you probably have noticed when going through a drive through that many of them have a timer clock by the window showing the current wait time. Why is this? This is because the company has deemed it important to monitor what the average wait time is for their customers. The smaller the average the higher the customer satisfaction...hence the name...fast food. The timer is there for the benefit of the line workers. Shift managers are well aware of what the acceptable average wait times are and are often compensated for staying within range or even beating expectations. What exception reporting does is collects all the information and presents it from a summary down to a granular basis. Follow me here...Somewhere, back at corporate there is a person who is responsible for managing what the average wait time is for their customers among other things. Now this person cannot sit there just staring at a dashboard that says what the average wait time is, so what they have done is setup some exception reporting. To do this, they have defined the acceptable limits in which the company allows. For example, an acceptable wait time is anywhere between 30 seconds and 3 minutes. Any time the average falls above that range, the responsible party is notified and is offered the ability to click on the number and receive a list of only those stores that are above the limits along with what their average wait time currently is.
Financial Example
Financial institutions commonly have very strict regulations that they must abide by and these regulations change often. Due to this, they often have implement a vast array of different information systems needed to meet these regulations. The problem is that now they have the burden of making sure that these systems are in balance. Any time you increase the complexity and diversity of all these information systems, you typically run into a data integration nightmare. You have data spread out among many systems, some of them duplicated and some not. In regards to the data that must be duplicated, it is important that those systems be able to reconcile with each other. Recently, I helped a company be able to do this. Their current process was to receive a report from one of their financial systems via a PDF, due to the system being a SaaS application with certain limitations and reconcile that with a legacy system they have. It was a few people job to look at this report that was over 2,000 pages and compare account balances across both systems. When the balances did not match, they had to look at the detail information and make any appropriate journal entries in order to correct it. Since neither of these systems "talked" to each other, this was a very hands on, manual process. Well, a little bit of know how and of course Pentaho, they now are able to connect to both systems and compare balances automatically and create a report that only contains accounts that don't reconcile with drill down to detail capability...saving days of several FTEs (full time employees).
Pentaho is rather unique in that the way our Data Integration and Business Analytics are architected, performing exception reporting is well exceptional. My apologies for such a corny ending...but...I am a father of 5...one has to have a sense of humor at this point ;)
BTW - Happy New Years to all my blog followers, I appreciate all your views!
Wednesday, November 16, 2011
Reporting from Multiple Disparate Data Sources
One of the many powerful features of Pentaho is the ability for Pentaho Reporting and Pentaho Data Integration to seamlessly work together. This example will walk through a typical use case within many organizations. Let's say you want to report of multiple disparate data sources. You may have a database, a csv file, and a flat file that you want to be able to join the data together and report from but you don't want to have to combine this data in a data store. Additionally, you may want to give the end users the ability to sort this data.
USE CASE - Reporting from Raw Call Log Summary Information
I have a client who has accesses to some summary telephony data that records the outbound calling of their agents. Besides having a record of these outbound calls, they have another solution that also records the inbound calls. This inbound system reporting is a separate from their outbound system in terms of the storage of that data. Both outbound and inbound record sets records the same information, AgentID, CallType, and Duration. The outbound data file CallType column all contain the same CallType of outbound and the inbound data file has the value of inbound. They want to merge these disparate files and also lookup the AgentID from another source that lists all their agents with their corresponding IDs, this way on their report they can list the agent name instead of their ID.
SOLUTION - Pentaho Data Integration and Pentaho Report Designer
Pentaho Data Integration
What I have done is use PDI to bring all the data together and make it available for Report Designer. The transformation is made up of the following steps:
- CSV file input - This is the outbound call records
- Excel Input - This is the inbound call records
- Append Streams - This merges the outbound and inbound records into one data set
- Stream Lookup - This step looks up the value of AgentID in order to get the Agent Name
- CSV file input 2 - This step contains the AgentID along with the corresponding Agent Name
- Sort rows - This sorts the rows by Agent Name
- Unique Rows - This returns a list of Unique Agent Names use in the parameter list within our report
- Create Parameter - This defines a parameter that will be used to filter the results
- Filter rows - This will use the parameter to filter out the desired results
- Filtered Results - Displays all the desired results
- Non Matching Results - Displays all the results that were not selected
Once this transformation is created then it needs to be exported as an .ktr (xml) file and is now ready to be consumed by Report Designer.
Pentaho Report Designer
Once in Report Designer I can create a report and add a Pentaho Data Integration data source. All I will need to do is point to that transformation location (this is the .ktr file that you exported from Pentaho Data Integration). When you bring that transformation into Report Designer, it will ask you to select which step to utilize. This give you the ability to report from any point within the data integration step listed above. For this example, we will consume information from the Filtered Results step. In this report, we are also building a parameter which allows end users of this report to select which Agent they want to view the data for. We are dynamically building this list by selecting the Unique Rows step in our data integration transformation.
In order to get this example to work in your environment, you will need to download the files here, these files include:
- Multiple Sources with Parameter.ktr - Transformation
- Sample Report from three Sources with Parm.prpt - Report
- outbound.csv - Contains outbound call log data
- inbound.xls - Contains inbound call log data
- agentLookup.csv - Contains Agent Name lookup by AgentID Data
Make the following modifications to the Multiple Sources with Parameter.ktr file:
- Open the Multiple Sources with Parameter.ktr by going into Pentaho Data Integration and selecting File -> Import from an XML File
- Edit the following steps and point them to the files you downloaded:
- CSV file input - point to outbound.csv
- Excel Input - point to inbound.xls
- CSV file input 2 - point to agentLookup.csv
- Save transformation (this will save it to your repository)
- Export the transformation to the location where you saved the original (you can overwrite the original)
Make the following changes in the Sample Report from three Sources with Parm.prpt in Report Designer:
- Open the Report in Report Designer
- Click on the "Data" tab on the right side of Report Designer
- Double Click "Agent List" under the Pentaho Data Integration Data Set, browse to your recently saved and exported transformation and select the "Unique rows" step in the steps list.
- Double Click "Query 1" under the Pentaho Data Integration Data Set, browse to your recently saved and exported transformation and select the "Filtered Results" step in the steps list.
- Click on the preview button to see it work.
Keep in mind that if you want to publish this report to your BI Server you will have to bring the Multiple Sources with Parameter.ktr as a report resource, for more information on this, please see the Using a Pentaho Data Integration Data Source with the Pentaho Report Designer blog entry I did back in May


Monday, November 14, 2011
Application Integration using Pentaho Data Integration
Last week I was on a call where the person wanted to be able to easily access their data base and make that data available to other applications via both xml and Json. Some of their other applications require XML but they have a few that also use Json and as an organization, they are moving toward consuming Json as well. This will show an example on how you can easily use Pentaho Data Integration to gain access to any data source (for this example we will use the sample database that comes with Pentaho).
Use Case Example - Customer Payment Information
Currently Acme Company has all of their customer payment information in a database and they want to expose that information to a new application financial forecasting system that will help them better forecast:
- How likely a particular customer is in making future payments
- Segment customer based on their Accounts Receivables Turnover
- What is the trend in Accounts Receivables Turnover
This new financial forecasting application can accept data via either XML or Json. The first step is to build a simple transformation made up of three steps.
- Table Input Step - This step will pull back data from the database
- XML Output Step - This step will convert the data into a XML format
- Json Output Step - This step will convert the data into a Json format
The answer to how Pentaho can do this is similar to the famous quote from Fried Green Tomatoes, "The secret is in the sauce." In both the XML Output and the Json Output, Pentaho has a very cool feature that is enabled by a simple check box, it is the "Pass output to servlet" checkbox. In other words, this exposes Pentaho Data Integration data over a web service. Matt Casters has also documented this on his blog here.
In order to test the example, simply import the .ktr in the link below into Pentaho Data Integration and save it to your Pentaho Data Integration Enterprise Repository and access via a simple url call:
http://localhost:9080/pentaho-di/kettle/executeTrans/?rep=Enterprise%20Repository&user=joe&pass=password&trans=/home/joe/json1
The transformation gives you two options for XML or Json Output. To switch between the two different output formats, open the transformation and enable/disable the appropriate hop.
Download Transformation Here


Tuesday, October 18, 2011
Use Case: Grouping by Time, A Call Center Story
Recently a company that operates a rather large call center came to Pentaho to help them be able to better analyze their data and gain better insight to the performance and efficiency of their agents. One of the issues they had was that they wanted to see their call center data grouped by particular time categories so that they can better manage staffing for peak hours of the day as well as view who are the top performing agents in terms of volume. They had some basic information but the problem was that they wanted to have the grouping within the database so that they can gain some additional performance in pre-aggregating the data, due to the large volume of calls that are occurring. Here is a sample of what the data looked like (the sample below is only sample data generated by a sample data generator).

The first step in this process is to make the data "BI Ready", in other words take the data and convert to information by enriching it and grouping it by the designated time buckets, for this particular example they want to bucket their time in 15 minute increments starting from 8:00 to 5:00 (the operating hours of the call center). In this example, I am only using a snapshot of data ranging from 8:00 AM to 9:00 AM. This will allow them to answer questions like
- During what time span (within 15 minutes) is the call volume the highest?
- What time categories have the highest volume of incoming calls?
- What time categories have the highest volume of outbound calls?
The end transformation looks like this:

Transformation Detailed Description
Read Call Center Data from CSV - This is a csv Input Step that reads in the data from the CSV file. This does not have to be a csv file but can be almost any flat file, database, web service, etc.
Convert Date-Time to String - This is a Select Values step that allows you to rename or change the type of any of your fields, in this step we are converting the date-time to a string in order to split it into two different fields, one field that contains only date and the other only time.
Split Date-Time Field - Field Splitter allows you to split any string field based on a common requirement. In this example because the date-time field called BeginDate in our csv file has a date-time field that is a format where the date and time are separated by a space, we use that as the delimiter to split the field.
Convert Time to Number - The convert time to number is used to convert the Time field that we created in the previous step to a number in order to do our grouping into time ranges.
Create Time Range - This step will create a new column called TimeGroup, read in the rows of data, look at the time field set the appropriate value to the newly created field. For this example we are creating four groups: 8:00 AM to 8:15 AM, 8:15 AM to 8:30 AM, 8:30 AM to 8:45 AM, and 8:45 AM to 9:00 AM.
Convert Time to Time Format - This step converts the time field back to the time data type for reporting purposes.
Dummy (do nothing) - this step, as it implies does nothing, at this point you can load the data directly into a database, flat file, etc.
The end result of this transformation looks like this:
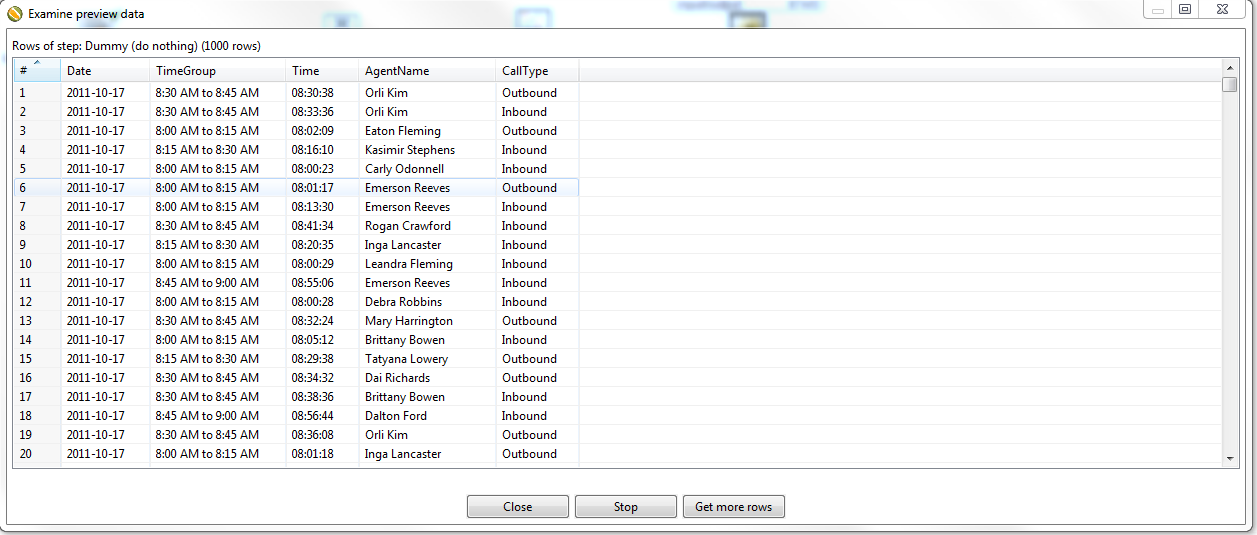
Download the zip file here for youto run this transformation. In order for it to work, you will need to import the .ktr file and then make sure to change the path of the csv file in the first step to the location of where you saved the csv file that is included in the .zip file.
Pentaho Data Integration Sample Library
When you download Pentaho and run our Data Integration
client tool (also known as Spoon), you also get a huge library of sample
transformations that can help you build out your solution. The great thing about these sample
transformation and jobs is that they are all working samples, so you can test
and learn by following the entire flow.
There are over 150 working sample transformation and over 40 working
jobs. You can access these
transformation and jobs anytime by going to the following directory:
[Install Directory]\pentaho\design-tools\data-integration\samples
To use any of these transformation in Pentaho Data
Integration follow these three easy steps:
- Start Pentaho Data Integration Client Tool (Spoon)
- Go to File > Import from an XML File

- Browse to the samples library location stated above and select the sample you wish to view and run.
Tuesday, October 04, 2011
At Pentaho, the best just keeps getting better!!!
At Pentaho, the best just keeps getting better:
http://www.marketwire.com/press-release/-1568941.htm
http://www.marketwire.com/press-release/-1568941.htm
Subscribe to:
Posts (Atom)