Wednesday, November 16, 2011

Reporting from Multiple Disparate Data Sources

One of the many powerful features of Pentaho is the ability for Pentaho Reporting and Pentaho Data Integration to seamlessly work together.  This example will walk through a typical use case within many organizations.  Let's say you want to report of multiple disparate data sources.  You may have a database, a csv file, and a flat file that you want to be able to join the data together and report from but you don't want to have to combine this data in a data store.  Additionally, you may want to give the end users the ability to sort this data.

USE CASE - Reporting from Raw Call Log Summary Information

I have a client who has accesses to some summary telephony data that records the outbound calling of their agents.  Besides having a record of these outbound calls, they have another solution that also records the inbound calls.  This inbound system reporting is a separate from their outbound system in terms of the storage of that data.  Both outbound and inbound record sets records the same information, AgentID, CallType, and Duration.  The outbound data file CallType column all contain the same CallType of outbound and the inbound data file has the value of inbound.  They want to merge these disparate files and also lookup the AgentID from another source that lists all their agents with their corresponding IDs, this way on their report they can list the agent name instead of their ID.

SOLUTION - Pentaho Data Integration and Pentaho Report Designer

Pentaho Data Integration
What I have done is use PDI to bring all the data together and make it available for Report Designer.  The transformation is made up of the following steps:

  1. CSV file input - This is the outbound call records
  2. Excel Input - This is the inbound call records
  3. Append Streams - This merges the outbound and inbound records into one data set
  4. Stream Lookup - This step looks up the value of AgentID in order to get the Agent Name
  5. CSV file input 2 - This step contains the AgentID along with the corresponding Agent Name
  6. Sort rows - This sorts the rows by Agent Name
  7. Unique Rows - This returns a list of Unique Agent Names use in the parameter list within our report
  8. Create Parameter - This defines a parameter that will be used to filter the results
  9. Filter rows - This will use the parameter to filter out the desired results
  10. Filtered Results - Displays all the desired results
  11. Non Matching Results - Displays all the results that were not selected


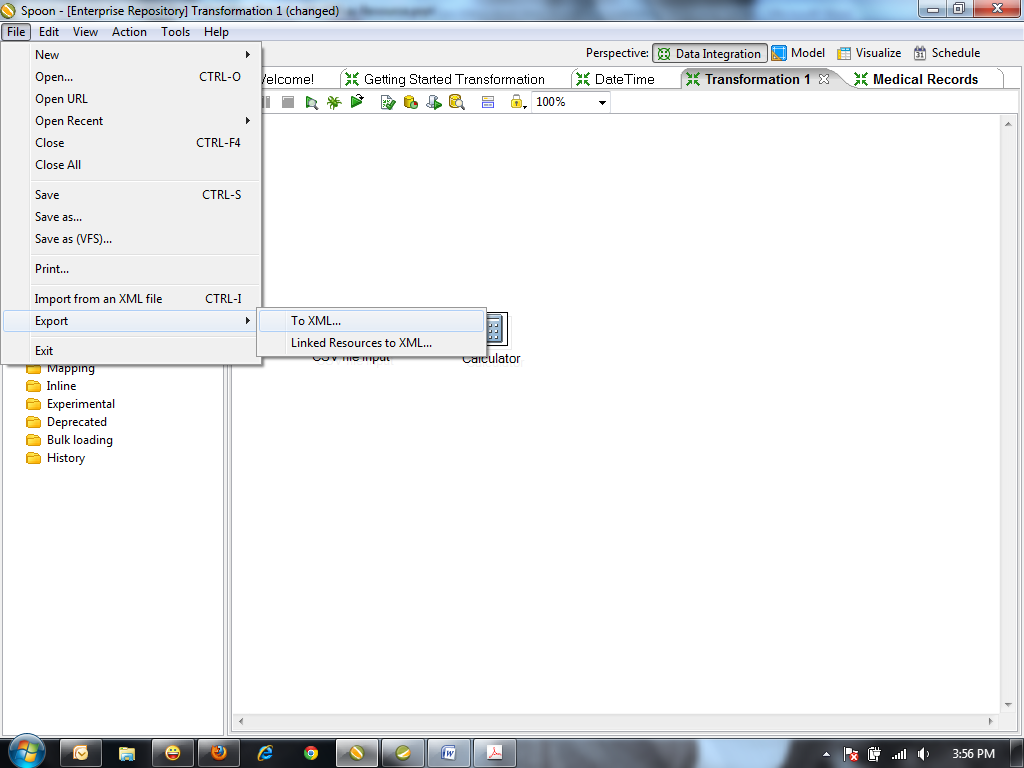
Once this transformation is created then it needs to be exported as an .ktr (xml) file and is now ready to be consumed by Report Designer.

Pentaho Report Designer

Once in Report Designer I can create a report and add a Pentaho Data Integration data source.  All I will need to do is point to that transformation location (this is the .ktr file that you exported from Pentaho Data Integration).  When you bring that transformation into Report Designer, it will ask you to select which step to utilize.  This give you the ability to report from any point within the data integration step listed above.  For this example, we will consume information from the Filtered Results step.  In this report, we are also building a parameter which allows end users of this report to select which Agent they want to view the data for.  We are dynamically building this list by selecting the Unique Rows step in our data integration transformation.

In order to get this example to work in your environment, you will need to download the files here, these files include:
  • Multiple Sources with Parameter.ktr - Transformation
  • Sample Report from three Sources with Parm.prpt - Report
  • outbound.csv - Contains outbound call log data
  • inbound.xls - Contains inbound call log data
  • agentLookup.csv - Contains Agent Name lookup by AgentID Data


Make the following modifications to the Multiple Sources with Parameter.ktr file:
  1. Open the Multiple Sources with Parameter.ktr by going into Pentaho Data Integration and selecting File -> Import from an XML File
  2. Edit the following steps and point them to the files you downloaded:
    1. CSV file input - point to outbound.csv
    2. Excel Input - point to inbound.xls
    3. CSV file input 2 - point to agentLookup.csv
  3. Save transformation (this will save it to your repository)
  4. Export the transformation to the location where you saved the original (you can overwrite the original)


Make the following changes in the Sample Report from three Sources with Parm.prpt in Report Designer:

  1. Open the Report in Report Designer
  2. Click on the "Data" tab on the right side of Report Designer
  3. Double Click "Agent List" under the Pentaho Data Integration Data Set, browse to your recently saved and exported transformation and select the "Unique rows" step in the steps list.
  4. Double Click "Query 1" under the Pentaho Data Integration Data Set, browse to your recently saved and exported transformation and select the "Filtered Results" step in the steps list.
  5. Click on the preview button to see it work.


Keep in mind that if you want to publish this report to your BI Server you will have to bring the Multiple Sources with Parameter.ktr as a report resource, for more information on this, please see the Using a Pentaho Data Integration Data Source with the Pentaho Report Designer blog entry I did back in May


Monday, November 14, 2011

Application Integration using Pentaho Data Integration

Last week I was on a call where the person wanted to be able to easily access their data base and make that data available to other applications via both xml and Json.  Some of their other applications require XML but they have a few that also use Json and as an organization, they are moving toward consuming Json as well.  This will show an example on how you can easily use Pentaho Data Integration to gain access to any data source (for this example we will use the sample database that comes with Pentaho). 

Use Case Example - Customer Payment Information

Currently Acme Company has all of their customer payment information in a database and they want to expose that information to a new application financial forecasting system that will help them better forecast:
  • How likely a particular customer is in making future payments
  • Segment customer based on their Accounts Receivables Turnover
  • What is the trend in Accounts Receivables Turnover
This new financial forecasting application can accept data via either XML or Json.  The first step is to build a simple transformation made up of three steps.
  1. Table Input Step - This step will pull back data from the database
  2. XML Output Step - This step will convert the data into a XML format
  3. Json Output Step - This step will convert the data into a Json format

The answer to how Pentaho can do this is similar to the famous quote from Fried Green Tomatoes, "The secret is in the sauce."  In both the XML Output and the Json Output, Pentaho has a very cool feature that is enabled by a simple check box, it is the "Pass output to servlet" checkbox.  In other words, this exposes Pentaho Data Integration data over a web service.  Matt Casters has also documented this on his blog here.

In order to test the example, simply import the .ktr in the link below into Pentaho Data Integration and save it to your Pentaho Data Integration Enterprise Repository and access via a simple url call:

http://localhost:9080/pentaho-di/kettle/executeTrans/?rep=Enterprise%20Repository&user=joe&pass=password&trans=/home/joe/json1

The transformation gives you two options for XML or Json Output.  To switch between the two different output formats, open the transformation and enable/disable the appropriate hop.

NOTE: This url call is specific to a generic installation of Pentaho Enterprise Edition.  The default installation port number is 9080, yours may vary depending on your installation

Download Transformation Here


Tuesday, October 18, 2011

Use Case: Grouping by Time, A Call Center Story

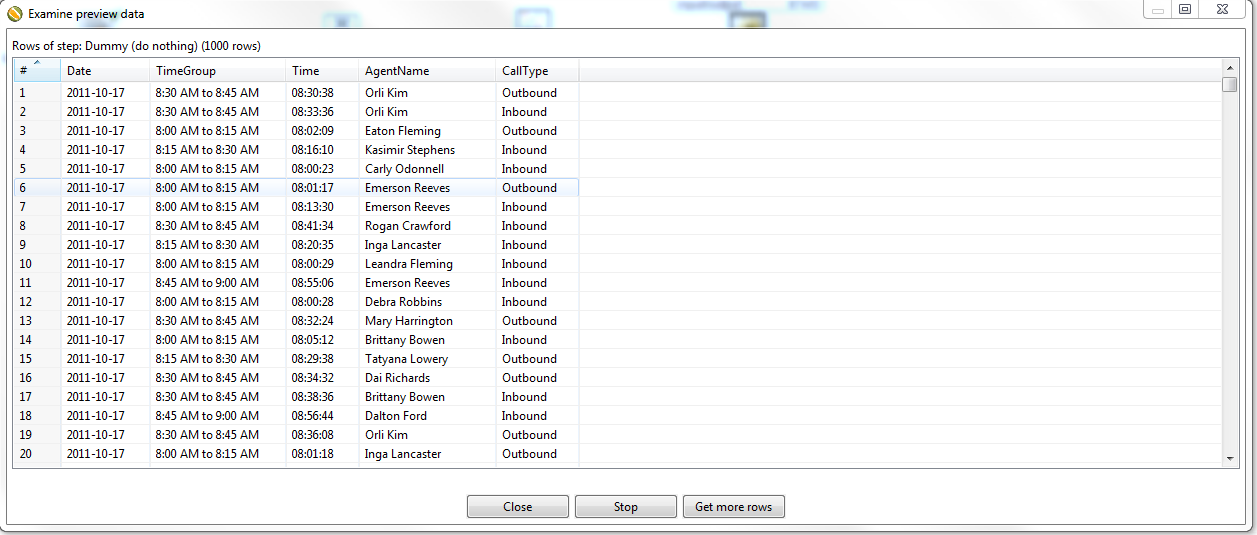
Recently a company that operates a rather large call center came to Pentaho to help them be able to better analyze their data and gain better insight to the performance and efficiency of their agents.  One of the issues they had was that they wanted to see their call center data grouped by particular time categories so that they can better manage staffing for peak hours of the day as well as view who are the top performing agents in terms of volume.  They had some basic information but the problem was that they wanted to have the grouping within the database so that they can gain some additional performance in pre-aggregating the data, due to the large volume of calls that are occurring.  Here is a sample of what the data looked like (the sample below is only sample data generated by a sample data generator).


The first step in this process is to make the data "BI Ready", in other words take the data and convert to information by enriching it and grouping it by the designated time buckets, for this particular example they want to bucket their time in 15 minute increments starting from 8:00 to 5:00 (the operating hours of the call center).  In this example, I am only using a snapshot of data ranging from 8:00 AM to 9:00 AM.  This will allow them to answer questions like

  • During what time span (within 15 minutes) is the call volume the highest?
  • What time categories have the highest volume of incoming calls?
  • What time categories have the highest volume of outbound calls?


The end transformation looks like this:


Transformation Detailed Description

Read Call Center Data from CSV - This is a csv Input Step that reads in the data from the CSV file.  This does not have to be a csv file but can be almost any flat file, database, web service, etc.

Convert Date-Time to String - This is a Select Values step that allows you to rename or change the type of any of your fields, in this step we are converting the date-time  to a string in order to split it into two different fields, one field that contains only date and the other only time.

Split Date-Time Field - Field Splitter allows you to split any string field based on a common requirement.  In this example because the date-time field called BeginDate in our csv file has a date-time field that is a format where the date and time are separated by a space, we use that as the delimiter to split the field.

Convert Time to Number - The convert time to number is used to convert the Time field that we created in the previous step to a number in order to do our grouping into time ranges.

Create Time Range - This step will create a new column called TimeGroup, read in the rows of data, look at the time field set the appropriate value to the newly created field.  For this example we are creating four groups:  8:00 AM to 8:15 AM, 8:15 AM to 8:30 AM, 8:30 AM to 8:45 AM, and 8:45 AM to 9:00 AM.

Convert Time to Time Format - This step converts the time field back to the time data type for reporting purposes.

Dummy (do nothing) - this step, as it implies does nothing, at this point you can load the data directly into a database, flat file, etc.

The end result of this transformation looks like this:


Download the zip file here for youto run this transformation.  In order for it to work, you will need to import the .ktr file and then make sure to change the path of the csv file in the first step to the location of where you saved the csv file that is included in the .zip file.

Pentaho Data Integration Sample Library


When you download Pentaho and run our Data Integration client tool (also known as Spoon), you also get a huge library of sample transformations that can help you build out your solution.  The great thing about these sample transformation and jobs is that they are all working samples, so you can test and learn by following the entire flow.  There are over 150 working sample transformation and over 40 working jobs.  You can access these transformation and jobs anytime by going to the following directory:

[Install Directory]\pentaho\design-tools\data-integration\samples

To use any of these transformation in Pentaho Data Integration follow these three easy steps:

  1. Start Pentaho Data Integration Client Tool (Spoon)
  2. Go to File > Import from an XML File


  3.   Browse to the samples library location stated above and select the sample you wish to view and run.


Sunday, September 18, 2011

Improving Performance with Pentaho Data Integration Table Input and Oracle

When using Pentaho Data Integration Table Input step to connect to Oracle via a JDBC connection there is a setting in your connection information that you can specify that can dramatically improve your performance in retrieving data.  This property is the defaultRowprefetch.  Oracle JDBC drivers allow you to set the number of rows to prefetch from the server while the result set is being populated during a query. Prefetching row data into the client reduces the number of round trips to the server. The default value for this property is 10.

In the table input step, edit your connection, click on the options tab and then enter in your defaultRowprefetch specification:

Monday, August 29, 2011

Creating drill down on charts within Report Designer

Report Designer has the capability of creating charts which you can link the individual values to other reports, creating a drill down chart. This document will help you to create a working example of this using the sample data that comes with Pentaho in addition to a canned sample report that comes with Pentaho (the Order Status report located under the Steel Wheels > Reporting solution folder).
  1. Create a new report with Report Designer and add a JDBC connection with the Sample Data and enter the following SQL into the Query Dialog Box.SELECT "ORDERFACT"."STATUS", sum("CUSTOMER_W_TER"."CREDITLIMIT") AS Sales FROM "ORDERFACT" INNER JOIN "CUSTOMER_W_TER" ON "ORDERFACT"."CUSTOMERNUMBER" = "CUSTOMER_W_TER"."CUSTOMERNUMBER" WHERE "ORDERFACT"."STATUS" NOT LIKE 'Shipped' GROUP BY "ORDERFACT"."STATUS" ORDER BY "ORDERFACT"."STATUS" ASC

  1. Add a chart to the Report Header in your new Report and configure it to be a bar chart showing the sales per order status
  1. Link to the existing Order Status report located on the BI Server under Steel Wheels\Reporting folder


    Make sure the formula reads as follows:

    =DRILLDOWN("local-prpt"; NA(); {"oStatus"; ["chart::category-key"] | "showParameters"; [STATUS] | "solution"; "steel-wheels" | "path"; "reports" | "name"; "Order Status.prpt"})
Preview the Report in HTML and click on the "On Hold" bar to see the drilldown action:


Thursday, August 25, 2011

Pentaho reporting and canned reports for distributed solutions

So recently I came across a use case that I helped someone work through that I thought my audience would find useful. Here it is;

Use Case

A company wants to offer Pentaho as the BI Application with their current solution. As part of this solution they want to create some canned reports that has the logo of the customer that is using their solution. Each customer will have the same report, because it is a report that is common across all their customers, however, they want the logo on the report to be that of the customer. Additionally, the solution is installed on premise at each individual customer site so the location of their solution in relation to the web application will be different for each customer (in other words, the installation and configuration of the Pentaho BI Server is different at each customer). In order to accomplish this in Report Designer, they must do the following steps:

  1. Place an image in the report

  2. Put the location of that image as an Open Formula consisting of: =[env::serverBaseURL] & "/pentaho/GetResource?resource=solution/folder_path/image_name.png


Here is a video presentation demonstrating this:


Thursday, May 12, 2011

AgileBI with Pentaho Business Intelligence

This is about a 9 minute demonstration on AgileBi using Pentaho Data Integration...


Tuesday, May 10, 2011

Pentaho LDAP Integration

In this short video I give a quick demonstration of Pentaho integrated with a 3rd Party LDAP. I will be working on creating a cheat sheet on how to configure what I show in the video, but for now...for your viewing enjoyment...I give you the video:


Monday, May 09, 2011

Using a Pentaho Data Integration Data Source with the Pentaho Report Designer

Pentaho Report Designer can consume an exported Pentaho Data Integration Transformation file (.ktr) as a data source to provide data to a Pentaho Report. The following steps walk you through the best practice when using this type of data source.


1. Export your transform to XML… from Pentaho Data Integration and save your .ktr file to a location on your computer


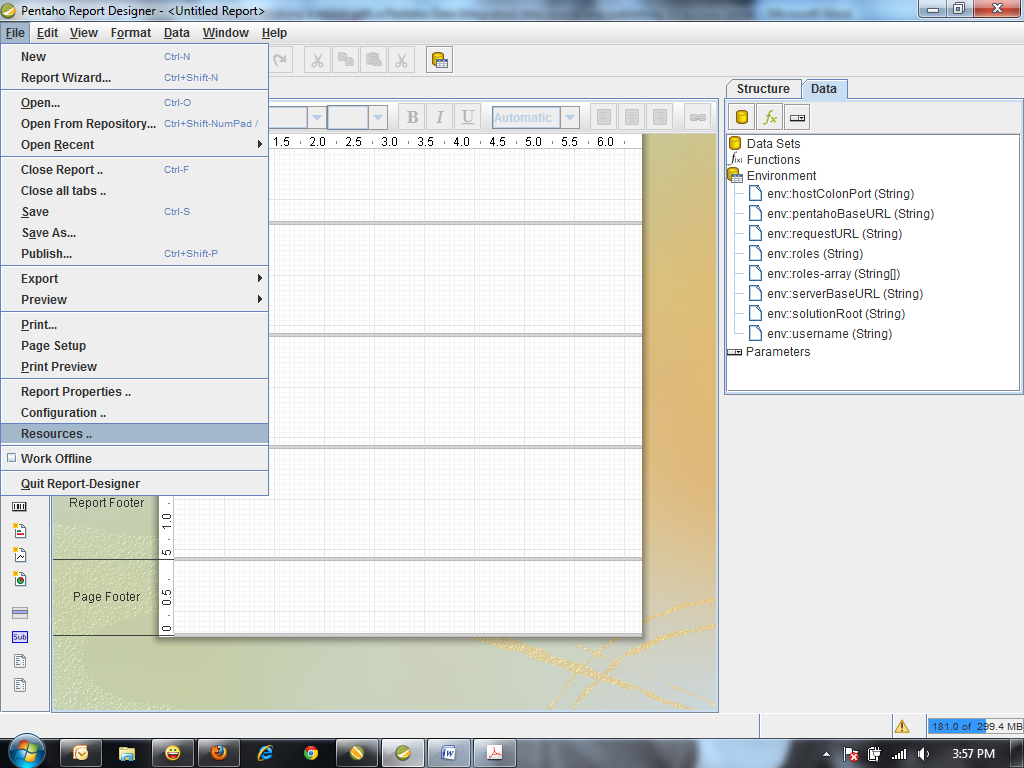
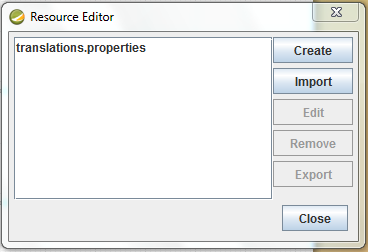
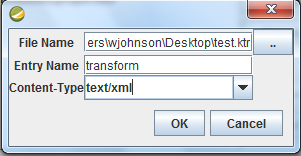
2. Import your transformation into your report as a Resource. In Report Designer, create a new blank report, select File -> Resources... -> IMPORT -> Select the ".." and browse to the transformation you exported in step 1, input an Entry Name (this name will be referenced later so please remember it), and then select text/xml for the Content-Type, then click OK and Close.


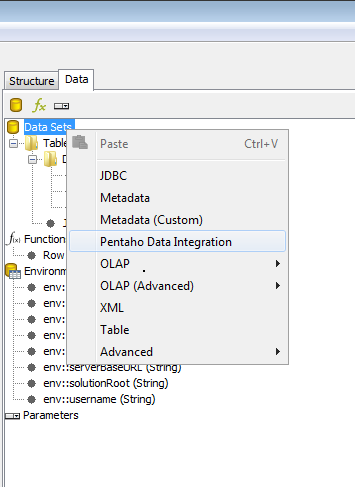
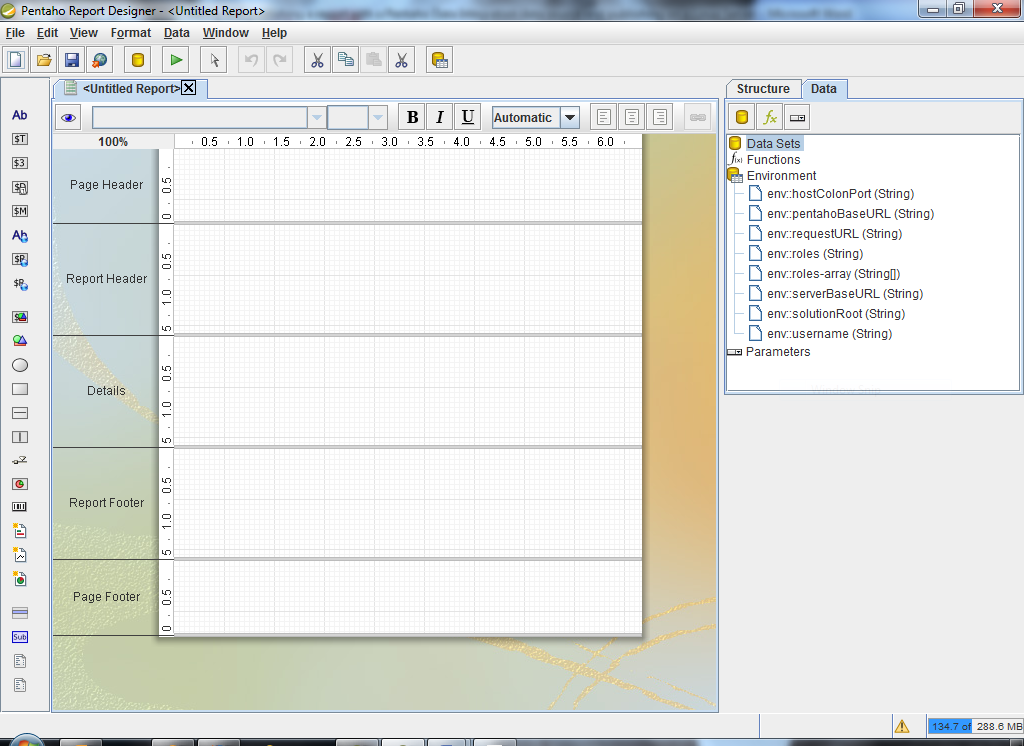
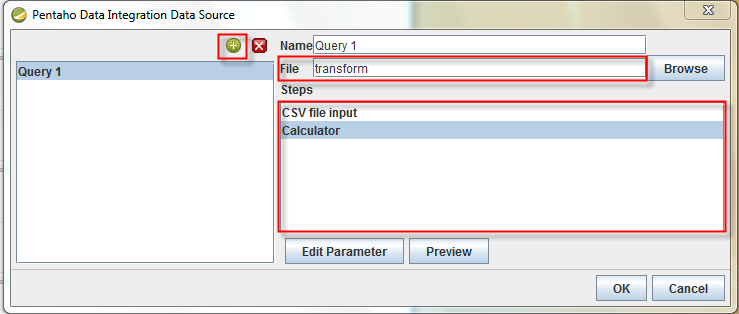
3. Right click on Data Sets and Select "Pentaho Data Integration", click the "add a new query" button


4. Build your report and publish it to the server as you normally would.

5. Please note that a Transformation with a limited result set (limited number of rows) is recommended at first. The design process will pull data from the transformation in real-time.

6. Publish to and access from Pentaho BI Server as you normally would any other Pentaho Report

7. There is a reference Techcast in greater detal located here:
https://pentaho.webex.com/pentaho/lsr.php?AT=pb&SP=EC&rID=34651817&rKey=d8748782d7bcdaa1

Sunday, December 19, 2010

Personal Business Intelligence

One definite benefit to working for a business intelligence company is having access to some of the coolest technology out there. I am one very busy person...sure working for the standard in Commercial Open Source Business Intelligence vendor Pentaho keeps me extremely busy with so many companies making the switch, I am also a single Dad raising 5 kids. As you can imagine, raising 5 kids requires a lot of management, one key area is where it gets rather expensive and I need to keep a good eye on is medical expenses...especially since they are tax deductible.

So what do my kids medical expenses have to do with Pentaho? Simple...with Pentaho, I can easily upload my data and use AgileBI to quickly analyze, gain insight, and take action on the information. Here is a screen shot of my kids medical dashboard:


As you can see here...Emily is my most accident prone kid, she represents the only child that has had the pleasure of visiting the emergency room. Additionally, I may need to make sure she is spending adequate time brushing her teeth as I see she represents a large portion of the dental expense. It also seems that I tend to spend a significant more on medical expenses during the school year...I guess when the kids are not at school, they tend to pick up less germs from the other students.

So in the end, this is not rocket science, but I guess that is my point...Pentaho has made is so easy to connect to data I already keep track of for my family and turn that data into information and help me see trends in my medical spending.

Tuesday, September 14, 2010

Radical Innovation

Still working on my recording, unfortunately Camtasia is not as easy to work with as Pentaho...speaking of Pentaho, I recently read an interesting article in the Harvard Business Review, "Wall Street Is No Friend to Radical Innovation" by Julia Kirby. In it she talkes about a study by Mary Benner of the Wharton School that was publish in Organization Science that examined the way that security analysts research and report on incumbent firms in industries undergoing disruptive change (take for example BI). "She finds that analysts tend to speak glowingly about innovations from major players that extend old technology, while downplaying the initiatives those firms have under way to capitalize on the next wave of technology"

To this I say, hmmm, and look at the latest press releases of Pentaho and say to Wall Street...don't miss out, here are only two of many examples:


Cheers!

Wednesday, July 28, 2010

The Right Tool For The Job - Part 2

In continuation of my previous post...I already had a tool to perform the duties I needed to changes the brakes but having just the right tool made all the difference in the time it took to successfully complete the task at hand. Took less time...and time is money!

The same holds true in BI. In the July/Aug 2010 issue of Information Management Magazine they had an articaled called Data Definition, How business and IT can speak the same language, Really. Notice how they added the word "Really" on the end of the title. This is because their is a LONG standing gap in the way IT understands data and the way that information consumers (business users) look at data. I don't know about you but nothing sounds more boring to me than defining data! I remember having vocabulary in most of my schooling where the teacher would assign a long list of words and your homework was to write out the definitions, not what I want to do on a Friday night. Looking back, that task was much easier than the daunting task for companies to define their data. The article referenced to above outlines what makes a clear or unclear data definition and one thing is certain, it takes BOTH IT and BUSINESS USERS to define data and is often a recursive task.

The article recommends the following strategy for defining your data:

  1. Provide examples of unclear versus clear definitions
  2. Understand what the business user wants to do with the data
  3. Bring all stakeholders together to review the definition
While step one is relatively easy to accomplish, Steps 2 and 3 are very difficult. The main reason is the way that IT and Business have to communicate together. This is where the right tool for the job comes in to play. You can either call it Pentaho Agile BI or simply mana from heaven. Either way you slice it, Pentaho Agile BI gives you the ability to complete items 2 and 3 above more quickly then anything else out there. Agile BI is the LINK that empowers IT and Business Users to "Speak the same language...Really!" In the coming week, I will be making a video demonstration on exactly what this looks like...make sure to check back to see!

Thursday, June 17, 2010

The Right Tool For the Job!

Some people would call me mechanically inclined and while others may call me mechanically challenged...either way...I tend to work on my vehicle probably more than the average person. One common maintenance activity that I do perform myself is changing the brakes on my vehicle. This is a fairly simple job in terms of concept but can be tedious due to the difficulty of getting to and working with the specific areas on the vehicle. For years I worked on these projects and it would typically take me about two hours to complete until one day, I was at an auto parts store and saw a special tool that was made specifically for part of the job of changing the brakes. It was like a gift from heaven, with this new tool, I was able to change the brakes in about 45 minutes with a lot less sweat and head ache.

So what does changing brakes have to do with BI? Nothing at all! However, the connection has to do with how using the right tool can help save you a lot of time and head ache in implementing and maintaining your BI environment. You may be successful right now but as some people say, "you don't know what you don't know" and you may have the opportunity to be even more successful. In the next few blog posts, I am going to talk about how Pentaho can help you just like me finding the right tool to help me change my brakes.