Thursday, August 25, 2011

Pentaho reporting and canned reports for distributed solutions

So recently I came across a use case that I helped someone work through that I thought my audience would find useful. Here it is;

Use Case

A company wants to offer Pentaho as the BI Application with their current solution. As part of this solution they want to create some canned reports that has the logo of the customer that is using their solution. Each customer will have the same report, because it is a report that is common across all their customers, however, they want the logo on the report to be that of the customer. Additionally, the solution is installed on premise at each individual customer site so the location of their solution in relation to the web application will be different for each customer (in other words, the installation and configuration of the Pentaho BI Server is different at each customer). In order to accomplish this in Report Designer, they must do the following steps:

  1. Place an image in the report

  2. Put the location of that image as an Open Formula consisting of: =[env::serverBaseURL] & "/pentaho/GetResource?resource=solution/folder_path/image_name.png


Here is a video presentation demonstrating this:


Monday, June 27, 2011

Pentaho 4.0 - Bursting in Pentaho Data Integration


For more information on the new Pentaho BI Suite 4.0, please visit Pentaho.com

Thursday, May 12, 2011

AgileBI with Pentaho Business Intelligence

This is about a 9 minute demonstration on AgileBi using Pentaho Data Integration...


Tuesday, May 10, 2011

Pentaho LDAP Integration

In this short video I give a quick demonstration of Pentaho integrated with a 3rd Party LDAP. I will be working on creating a cheat sheet on how to configure what I show in the video, but for now...for your viewing enjoyment...I give you the video:


Monday, May 09, 2011

Using a Pentaho Data Integration Data Source with the Pentaho Report Designer

Pentaho Report Designer can consume an exported Pentaho Data Integration Transformation file (.ktr) as a data source to provide data to a Pentaho Report. The following steps walk you through the best practice when using this type of data source.


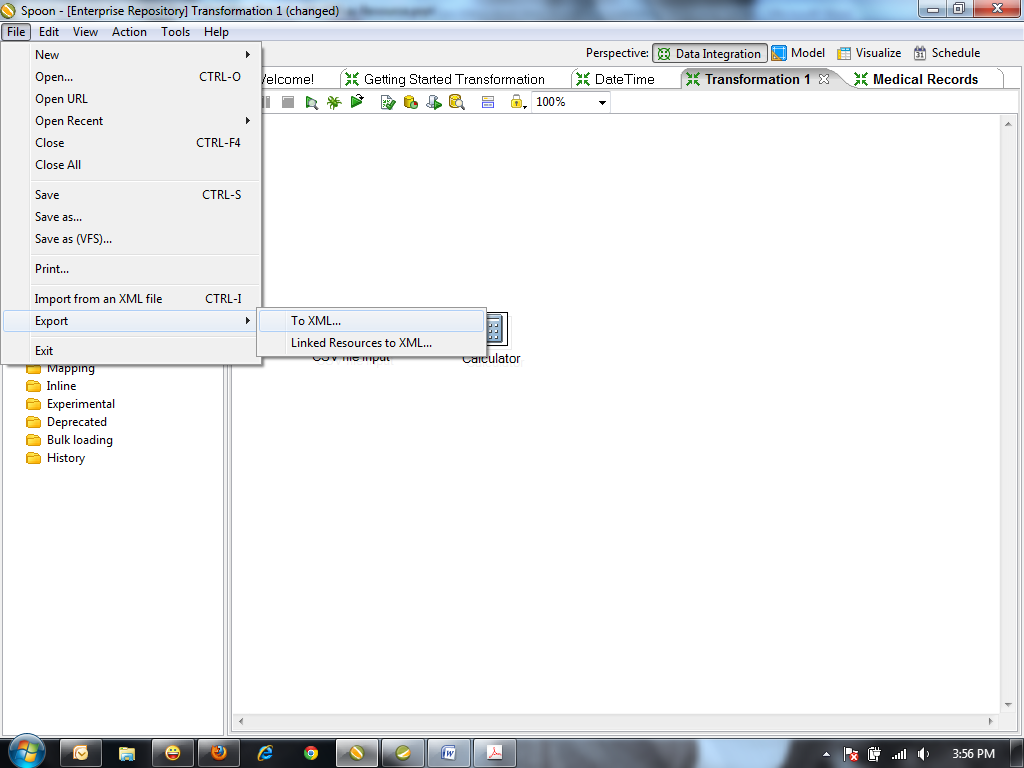
1. Export your transform to XML… from Pentaho Data Integration and save your .ktr file to a location on your computer


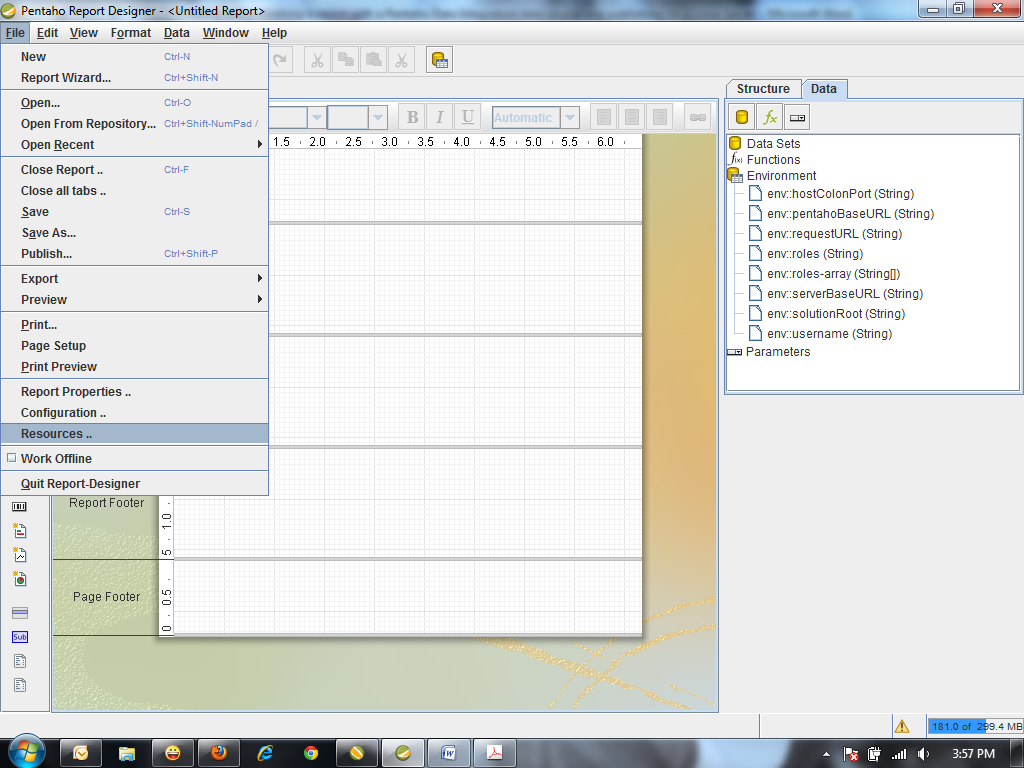
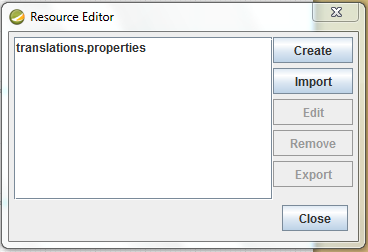
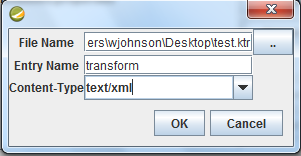
2. Import your transformation into your report as a Resource. In Report Designer, create a new blank report, select File -> Resources... -> IMPORT -> Select the ".." and browse to the transformation you exported in step 1, input an Entry Name (this name will be referenced later so please remember it), and then select text/xml for the Content-Type, then click OK and Close.


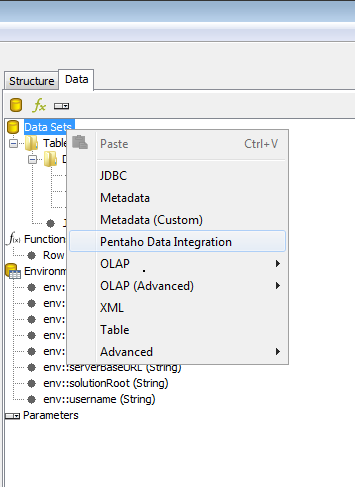
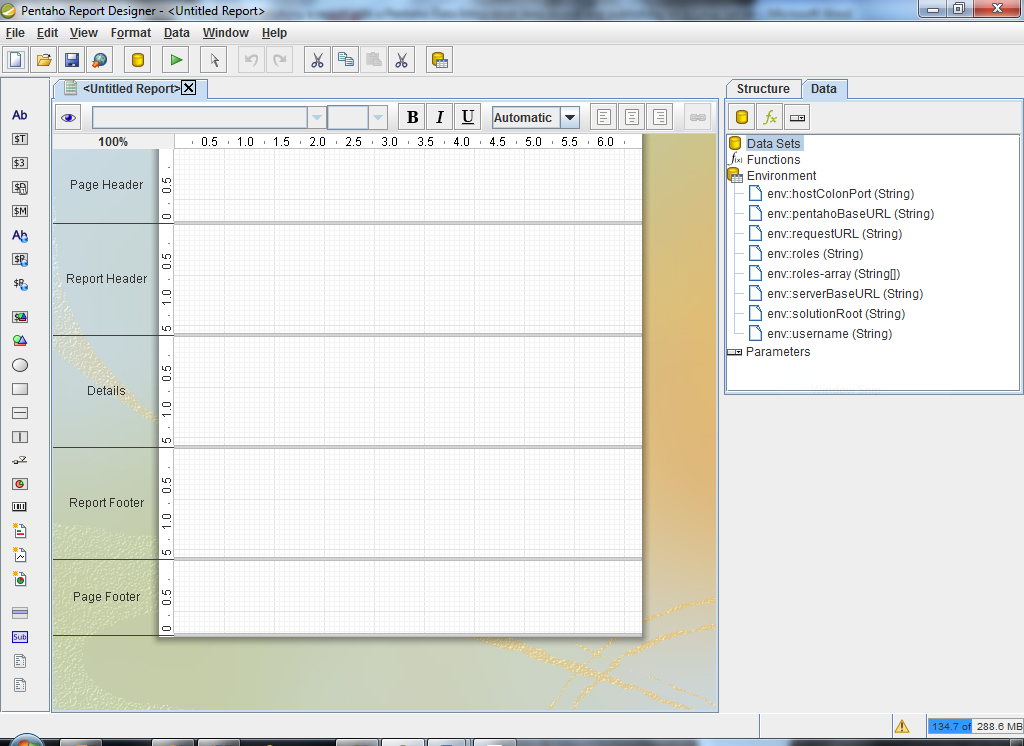
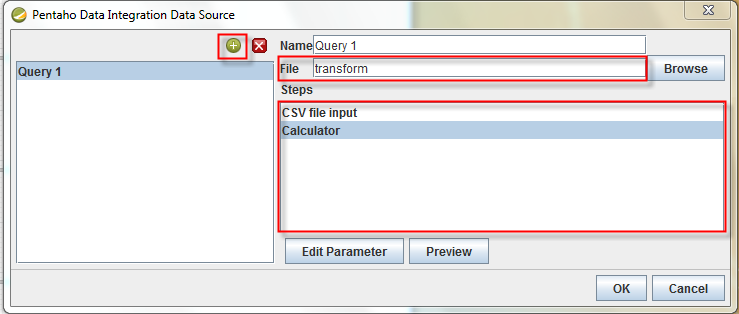
3. Right click on Data Sets and Select "Pentaho Data Integration", click the "add a new query" button


4. Build your report and publish it to the server as you normally would.

5. Please note that a Transformation with a limited result set (limited number of rows) is recommended at first. The design process will pull data from the transformation in real-time.

6. Publish to and access from Pentaho BI Server as you normally would any other Pentaho Report

7. There is a reference Techcast in greater detal located here:
https://pentaho.webex.com/pentaho/lsr.php?AT=pb&SP=EC&rID=34651817&rKey=d8748782d7bcdaa1

Sunday, December 19, 2010

Personal Business Intelligence

One definite benefit to working for a business intelligence company is having access to some of the coolest technology out there. I am one very busy person...sure working for the standard in Commercial Open Source Business Intelligence vendor Pentaho keeps me extremely busy with so many companies making the switch, I am also a single Dad raising 5 kids. As you can imagine, raising 5 kids requires a lot of management, one key area is where it gets rather expensive and I need to keep a good eye on is medical expenses...especially since they are tax deductible.

So what do my kids medical expenses have to do with Pentaho? Simple...with Pentaho, I can easily upload my data and use AgileBI to quickly analyze, gain insight, and take action on the information. Here is a screen shot of my kids medical dashboard:


As you can see here...Emily is my most accident prone kid, she represents the only child that has had the pleasure of visiting the emergency room. Additionally, I may need to make sure she is spending adequate time brushing her teeth as I see she represents a large portion of the dental expense. It also seems that I tend to spend a significant more on medical expenses during the school year...I guess when the kids are not at school, they tend to pick up less germs from the other students.

So in the end, this is not rocket science, but I guess that is my point...Pentaho has made is so easy to connect to data I already keep track of for my family and turn that data into information and help me see trends in my medical spending.

Tuesday, September 14, 2010

Radical Innovation

Still working on my recording, unfortunately Camtasia is not as easy to work with as Pentaho...speaking of Pentaho, I recently read an interesting article in the Harvard Business Review, "Wall Street Is No Friend to Radical Innovation" by Julia Kirby. In it she talkes about a study by Mary Benner of the Wharton School that was publish in Organization Science that examined the way that security analysts research and report on incumbent firms in industries undergoing disruptive change (take for example BI). "She finds that analysts tend to speak glowingly about innovations from major players that extend old technology, while downplaying the initiatives those firms have under way to capitalize on the next wave of technology"

To this I say, hmmm, and look at the latest press releases of Pentaho and say to Wall Street...don't miss out, here are only two of many examples:


Cheers!

Wednesday, July 28, 2010

The Right Tool For The Job - Part 2

In continuation of my previous post...I already had a tool to perform the duties I needed to changes the brakes but having just the right tool made all the difference in the time it took to successfully complete the task at hand. Took less time...and time is money!

The same holds true in BI. In the July/Aug 2010 issue of Information Management Magazine they had an articaled called Data Definition, How business and IT can speak the same language, Really. Notice how they added the word "Really" on the end of the title. This is because their is a LONG standing gap in the way IT understands data and the way that information consumers (business users) look at data. I don't know about you but nothing sounds more boring to me than defining data! I remember having vocabulary in most of my schooling where the teacher would assign a long list of words and your homework was to write out the definitions, not what I want to do on a Friday night. Looking back, that task was much easier than the daunting task for companies to define their data. The article referenced to above outlines what makes a clear or unclear data definition and one thing is certain, it takes BOTH IT and BUSINESS USERS to define data and is often a recursive task.

The article recommends the following strategy for defining your data:

  1. Provide examples of unclear versus clear definitions
  2. Understand what the business user wants to do with the data
  3. Bring all stakeholders together to review the definition
While step one is relatively easy to accomplish, Steps 2 and 3 are very difficult. The main reason is the way that IT and Business have to communicate together. This is where the right tool for the job comes in to play. You can either call it Pentaho Agile BI or simply mana from heaven. Either way you slice it, Pentaho Agile BI gives you the ability to complete items 2 and 3 above more quickly then anything else out there. Agile BI is the LINK that empowers IT and Business Users to "Speak the same language...Really!" In the coming week, I will be making a video demonstration on exactly what this looks like...make sure to check back to see!

Thursday, June 17, 2010

The Right Tool For the Job!

Some people would call me mechanically inclined and while others may call me mechanically challenged...either way...I tend to work on my vehicle probably more than the average person. One common maintenance activity that I do perform myself is changing the brakes on my vehicle. This is a fairly simple job in terms of concept but can be tedious due to the difficulty of getting to and working with the specific areas on the vehicle. For years I worked on these projects and it would typically take me about two hours to complete until one day, I was at an auto parts store and saw a special tool that was made specifically for part of the job of changing the brakes. It was like a gift from heaven, with this new tool, I was able to change the brakes in about 45 minutes with a lot less sweat and head ache.

So what does changing brakes have to do with BI? Nothing at all! However, the connection has to do with how using the right tool can help save you a lot of time and head ache in implementing and maintaining your BI environment. You may be successful right now but as some people say, "you don't know what you don't know" and you may have the opportunity to be even more successful. In the next few blog posts, I am going to talk about how Pentaho can help you just like me finding the right tool to help me change my brakes.

Thursday, April 16, 2009

Flexibility and Complexity in Business Intelligence

Where to star, where to start? Let's begin by defining what I mean by Flexibility and Complexity:

Flexibility - The ability to do what you need to do. In regards to BI or technology in general, it is the ability to build a custom application to meet your specific, customized needs.

Complexity - The measure of how difficult a particular task, system, technology, what have you, is. This term is also used many times as usability, which is not necessarily true. Something may be very usable to an engineer but not to a typical user.

Many times, too many to count, I have companies requesting a BI tool that "Offers great flexibility and powerful enough for developers to use but easy enough for end users to use as well". This is a very common misplaced expectation that people have. The reason is simple, there is an direct relationship between flexibility and complexity. Take a look at this graph and you will see what I mean.


Basically, the more flexibility that you require a technology, a tool, a software package to be, the more complex it becomes. Think about it this way...let's say you wanted to buy a car. You go to the show room and the only choice you have is one car and two colors, red or blue. That is a very simple decision, basically what color do you prefer? This option offers very little flexibility, however, it offers very little complexity in making a decision. Now let's take this a step further, the dealer offers you the following option, you can choose between a 2.1 ltr engine or a 3.4 ltr engine, you also can choose between a regular gas or hybrid. You also get to choose between 5 different stereo packages, an extended warranty, leather or cloth seats, 5 speaker or 8 speaker system, tow package, child safety features. All of these options increase the flexibility you have in owning a car that meets your specific needs (flexibility), however, now the decision you have is much more complex. You need to research the benefits of hybrid over gas, 5 speaker or 8, extended warranty or not. You see with these added options (flexibility) comes added complexity in you final decision making.

Technology is the same way, especially when it comes to Business Intelligence. When a user comes to me and asks me for a tool that is flexible enough to meet all the needs of a BI developer while making it very easy to use (not complex), it tells me that they do not have very much experience evaluating enterprise level software solutions. Enterprise software companies spend much time and expense in developing tools that meet the needs of specific user communities. So what I have done is taken the chart above and added the different user groups.


Going through my stats on my blog I notice I get a lot of hits from people who are looking at implementing BI and to those people I say, keep this chart in mind. Evaluate each individual tool for the intended audience and do not try to solve your problem with a "fits all sizes" approach because we all know that "one size fits all" does not mean "fits like a glove" but rather "minimum required to accomplish its basic task"

Monday, March 16, 2009

Information Over Load


Information Over Load

I love technology.  Technology has improved my life greatly, especially considering my income is completely related to technology.  There is a downside to all this technology though and I don't think that we may even be able to scratch the surface on how all of this will affect our future.  When a pharmaceutical company comes out with a new drug, it must first go through rigid testing to find out how that drug may adversely affect us.  There may be some benefit to analyze our technology this way as well.

Facebook.com, MySpace.com, Linkedin.com, and Twitter.com are some fairly recent examples of new and innovative Web 2.0 type applications that are having a profound affect on our society.  Take facebook, my daughters are constantly on facebook, they chat with their friends, send them messages, post pictures.  If you ever want to know what is going on in their life, you don't need to sit down at the dinner table, simply log onto facebook and you will find out everything.  My point in all this is that today, there is a ton of information out there for anything and anyone.  We are constantly being bombarded by information, status updates, profile updates, picture updates, tweets, twitters, whatever.  This presents a new problem moving forward.  

In the past, businesses had a difficult time making decisions due to not having enough information.  Business Intelligence is around because companies need access to crucial information that was buried deep down in their computer systems and again, the problem that was typical was that they could not get to the information, therefore, limiting the amount of data you had access to.  I think we can all agree that technology has come to a point that we are really no longer limited by it.  We are now limited by the processing power of the human brain.  I believe it was in the book Good to Great where author Jim Collins wrote in one of the chapters about a brokerage firm and how they were able to maximize the effectiveness of their brokers.  They did a study to find out what the maximum number of contacts could handle without letting any fall through the cracks...these contacts would include both actual clients and prospects.  You see the brokers would spend hours and hours on the phone, making hundreds of dials a day...they are limited to the number of times they could dial the phone and reach the person they were intending to reach.  Factor in time for dial, leaving voice mail, missing a returned call, calling prospects and clients back calculated to 300 contacts in their 'books'.  At the time I read this I was the IT Director at a major investment relations firm.  So what did I do?  Using the data I had been collecting on our call center, I wrote a BI application to analyze the results that Jim Collins found and I was able to verify the information and make the appropriate recommendations to our sales.

Similar to brokers only having enough cycles to handle a book (list of prospects and clients) of about 300, information consumers only have enough bandwidth and brain power to handle only so much information.  For example, think of the CEO in your company.  He has information coming to him constantly.  It may be human resources related, sales related, operations related, production/manufacturing related, marketing related, merger and acquisition related, external economics related, personal/family related.  Our brains can only handle so much at a time, and we cannot upgrade to a brain clustered environment.  All of this information is competing with each other.  So the question is how much information can we handle before we reach information overload and start blocking out things....or information starts falling through the cracks.  I was once consulting with a company on developing their web presence and when we were discussing the home page of their site, I asked, what I thought at the time was a relatively simple question, "What is the most important thing you want to point out about your company?"  The answer they gave me was frustrating.....they said,"everything".  This resulting in a hours long discussion about, if everything stands out then nothing stands out.  It reminds me of a despair.com saying, "You are special, just like everyone else".

What does this long rant have to do with BI?  Well, BI is presenting information that is simply just noise among noise.  It is information that is fed to whichever information consumer we deem to require it and we expect the end user to determine it's importance.  Here is what we need...we need a system that can automatically inform us in a manner that will give it a larger priority over all the other noise and in a way we understand and respond to.  This is where technology innovation has to meet creativity.  Stephen Few has some good examples and blogs about meaningful ways to present data in an efficient and concise manner.

The purpose of this post is not to give you a solution to this problem but rather present a discussion point on how BI can help become a filter for all of this noise.


Friday, February 13, 2009

Do you know your data?

Some things never cease to amaze me. BusinessIntellienge (according to Wikipedia) has been around for over 50 years. Despite this fact, all too often companies are inadequately providing the basic foundation for Business Intelligence. Here is one small example….knowing what data you use to make decisions. Whether it is a government organization, public company, or private company, they typically know what information they need to make their most important decisions, at least from a business perspective, however, from a data perspective, IT typically has very little insight into what data is actually being used.

Let’s check out a typical example. I have seen countless times where companies are implementing new systems that require major database changes. Well, when these changes are made, IT typically has a very difficult time determining exactly what data is being used, by what reports, by which users, not to mention how many times. Now if you think about it, this is very important information. In our society now, it is easy to get lost in data, there are so many sources of information, such as this blog, news sites, facebook, myspace, linkedin, drudgereport. I think we all can agree that the problem is not if the information exist, it is, can we find it and if we can, can we connect to it. So why are the questions about the data so important?

What data is being used? By whom? How often? This is important, especially when implementing solutions such as a data warehouse. Data Warehouse implementation can be very costly and often fail even after spending hundreds of thousands of dollars above what the budget required. Many of these failures can be prevented by the ability of knowing the answer to these questions. I have been working on a project where I an organization has to transfer 200 reports that are on their legacy system and have recreate them using Crystal Reports on their new ERP system. The process is to analyze each report, find out what fields were used to create that particular report and then look to see if the data was converted to the new ERP system. What sense does this make? All of these reports are considered mission critical by this organization, so my question is why is a field in a report that is mission critical no longer available in the new ERP system. A best practice approach could have been taken here before the data conversion process if the organization new which reports were mission critical and were able to generate a report that listed all the fields within those reports.

While I was at Information Builders, Inc. using WebFOCUS, they had a fantastic product called Resource Analyzer that at a click of a button, you would have access to hundred of reports that gives you the ability to analyze what data is being used, by whom, how often. Not only that, but it could also provide you with some what if analysis…for example…what if I removed this field from our database? What reports would that affect? What users would be affected? I don’t know about you but before I make any major changes I definitely want to make sure I know the impact it will have on upper management.

Friday, February 06, 2009

Be your own Gartner! What BI tools have you used and how do YOU rank them?

This particular post is really to solicit comments and get an interaction of BI professionals and users on their experience with BI tools and how they rank them. If you have ever used a BI tool, please comment on which ones and the pros and cons you have for each of them. Constructive feedback only, this is not meant to be a vendor bashing opportunity or a vendor promoting opportunity and those type of comments will not make it. Just plain old honest feedback.

At the very least, simply fill out the survey to the right ----------->

Thursday, January 29, 2009

Five Critical Criteria to start your BI Initiative


1.       Desire Intelligence

This may sound like a given, right?  Well, not necessarily.   Often times I have seen companies approach a BI initiative simply because it is a current industry trend, other CIO’s are doing it so why don’t we.  If our competitors are doing it then we need to stay competitive and do it as well.  WRONG!  Like many things in life, doing something because you feel like you feel like you are forced to will only result in a half hazard attempt and ending in a costly mistake.  So the first step, the first requirement to start a BI initiative is to desire intelligence.  You must crave it, want it, need it, hunger after it, you get the message.  What does that really mean?  You must have a passion for improving your organization through the gathering and analyzing data and applying intelligence in order to turn that data into usable, actionable, priceless information.

Example - While working for a BI vendor, we had a new branch manager come in and he started to immediate gather and analyze information on the current branch he just acquired.  Looking at contracts that were in place, looking at opportunities that were in the pipeline and most importantly looking at the employees.  All this to ensure that this branch would be successful.  During my interview with him, he mentioned to me that he was unsure of what to think about me because I did not have a long history of selling enterprise level software and as a sales engineer that is important.  Well after about an hour of discussion, he told me that he knew that I would be successful because I was extremely passionate about Business Intelligence and helping our customers achieve success.  He was less concerned at that point about what I have done in the past because he was confident of what I will do in the future.  This is an example of how we should approach BI, like the branch manager, come into the project with the desire to learn and analyze the data, recognize passion and don’t let the past be a stumbling block…we will get more to that point in criteria #3.

2.       Know your Business and your Industry

Okay, now I may sound like I am contradicting myself because earlier I said that you shouldn’t go after BI just because it is a popular thing to do or your competitors are doing it.  In context that is true, the entire process should start with desire to make your organization more intelligent.  Another thought here is, “Of course I know my business”.  Fair enough but many times when an organization is implementing some type of Business Intelligence solution, it is lead by the IT department.  While the IT group in your organization may be very familiar with your business and industry, it is only secondary to their knowledge of technology.  Those running the business, those responsible for the primary activities of the revenue generating functions of your business are really the ones who should lead these types of projects.  Without a business sponsor, the project is surely on a path of failure.

3.       Forget about limitations

Another critical reason for these types of initiatives to be driven by the business and not IT is it is much easier for the business to forget about limitations.  Business Intelligence is all about innovation, which I will be blogging about in the coming week (innovation that is).  A major adversary of innovation are limitations.  By first taking into consideration our limitations, we automatically limit the possibilities and success of our solutions.  If IT were driving this type of project, they would automatically be biased by technology limitations.  So know your thinking, “What good is it to come up with an idea that is impossible, that just wastes time and money.”  Oh contraire mon fraire, you see as humans we always limit ourselves by what we know.  Just because we do not know how to do it doesn’t mean it cannot be done.  I learned this lesson the hard way; I was the IT Director for a company whose CEO was constantly coming up with impossible ideas.  In the beginning, the phrase, “We can’t do that, that is impossible” was a common phrase being thrown around.  After repeating that over and over and after reading Bill Gates book “Business at the speed of thought”, I realized that I was too quick to make this statement.  This realization helped me create many solutions at that company that was years in advanced of what was commercially available, and believe it or not, at a fraction of the cost.  It is a natural human propensity to limit ourselves by our own knowledge.

On the business side, make sure you do not think also in terms of what is available, don’t limit yourself to knowledge you know is within your industry but rather information that may be outside your industry but has a direct or indirect affect on your business.  For example, I was working with a prospect on a potential solution, when learning their process for forecasting, I learned that they use over 25 different variables in order to forecast their product manufacturing.  They were able to look beyond their history, so in other words, they did not just look at past performance but rather measured that performance against other variables to establish a relationship and conversely apply that relationship toward future trends of those variables, for example consumer confidence, gasoline prices, new home sales, all of these examples require data that is most likely not controlled by your organization but by leveraging this type of out of our boundaries data you can make your organization much more intelligent.

4.       Don’t forget what you learned in grade school

I know you learned a lot of basic stuff in grade school but here I am referring to more specifically your science class, remember, the one Ms. Wilson taught, the one about the scientific method.  Just in case you do not remember, here they are (http://www.sciencebuddies.org/science-fair-projects/project_scientific_method.shtml) :

a.       Ask a Question

b.      Do your Research

c.       Construct a Hypothesis

d.      Test your Hypothesis

e.      Analyze your data and draw a conclusion

f.        Communicate your results

Following this method will help you form what your solution should be.


5.       Break requirements up into must have and nice to have

The “Communicate your results” in the scientific method actually makes up this portion of the criteria of success.  You must document everything you have learned up until this point in order to gain support for your new BI initiatives.  This information will be vital in generating expected ROI.  This document will also be vital in the next phase of your BI implementation which is selecting a technology vendor.  In the coming week I will outline some guidelines in selecting a technology vendor, and you may be surprised by what I say.

Friday, September 19, 2008

My New Blog

Just to let everyone know. This will be my first and final announcement of a new blog I have started...it is my personal blog to cover subject ranging from religion to politics....hmmmm...very controversial huh.

Here it is ----> http://arubawayne2.blogspot.com/

Tuesday, May 13, 2008

Success comes IF

My kids had to memorize this poem for school. That was the first time I heard it and I thought it was probably one of the most powerful poems I have ever read.


IF - by Rudyard Kipling

If you can keep your head when all about you Are losing theirs and blaming it on you,If you can trust yourself when all men doubt you,But make allowance for their doubting too;If you can wait and not be tired by waiting,Or being lied about, don't deal in lies,Or being hated, don't give way to hating,And yet don't look too good, nor talk too wise:

If you can dream - and not make dreams your master;If you can think - and not make thoughts your aim;If you can meet with Triumph and DisasterAnd treat those two impostors just the same;If you can bear to hear the truth you've spokenTwisted by knaves to make a trap for fools,Or watch the things you gave your life to, broken,And stoop and build 'em up with worn-out tools:

If you can make one heap of all your winnings And risk it on one turn of pitch-and-toss,And lose, and start again at your beginningsAnd never breathe a word about your loss;If you can force your heart and nerve and sinewTo serve your turn long after they are gone,And so hold on when there is nothing in youExcept the Will which says to them: 'Hold on!'

If you can talk with crowds and keep your virtue,' Or walk with Kings - nor lose the common touch,if neither foes nor loving friends can hurt you,If all men count with you, but none too much;If you can fill the unforgiving minuteWith sixty seconds' worth of distance run,Yours is the Earth and everything that's in it,And - which is more - you'll be a Man, my son!

Saturday, January 05, 2008

2008 Election - The Most Important Issue

With the election in full swing, I wanted to make clear that this election has only ONE important issue that must be addressed, everything else depends on this one issue. What issue is this? It is NATIONAL SECURITY. We can spend all day debating whether or not we should have government healthcare (socialized healthcare), fair tax, abortion rights, etc, however, one important factor is that there is no need depating any of these issues if we have no country!

Some may think, wow Wayne, that is quite alarming and that is just a scare tactic. For all of you that think this I challenge you to read Glenn Beck's new book, An Inconvenient Book.

Wednesday, January 03, 2007

Saddam's Hanging

Saddam Hussein was executed a couple of days ago and there are is a video of it. Several month's ago I would have rejoiced in the death of Saddam but my outlook seems to be different now that it has actually happened. Most people will read this and say WHAT! But let me explains my points:

1. Do I think Saddam got what he deserved? Of course, he was an evil man. He killed many people and was a savage. He idolized Hitler and got 100% what he deserved. I do think justice was served.

2. Do I think there was a better way to server justice? Not really, I believe in the death penalty and so I believe the punishment fit the crime.

3. So why are you not happy? Well I not only think of Saddam as a tyrannical dictator responsible for the death of hundreds of thousands of people but I also think of him as a soul. I am not casting judgement for it is not my place to do so but rather God's, however, based that he went down without any "change of heart", his soul was lost. I don't think Christians should rejoice whenever a soul has been lost. We can rejoice that he cannot kill or hurt anyone anymore but we also grieve for the loss of a soul.

At the end of the day, the death of Saddam is bitter sweet. I would imagine that it would be more sweet to me if he had a direct impact on my life such as killed one of my family members however I would hope that I would remain compassionate for those that are lost.